Fig. 3
Download original image
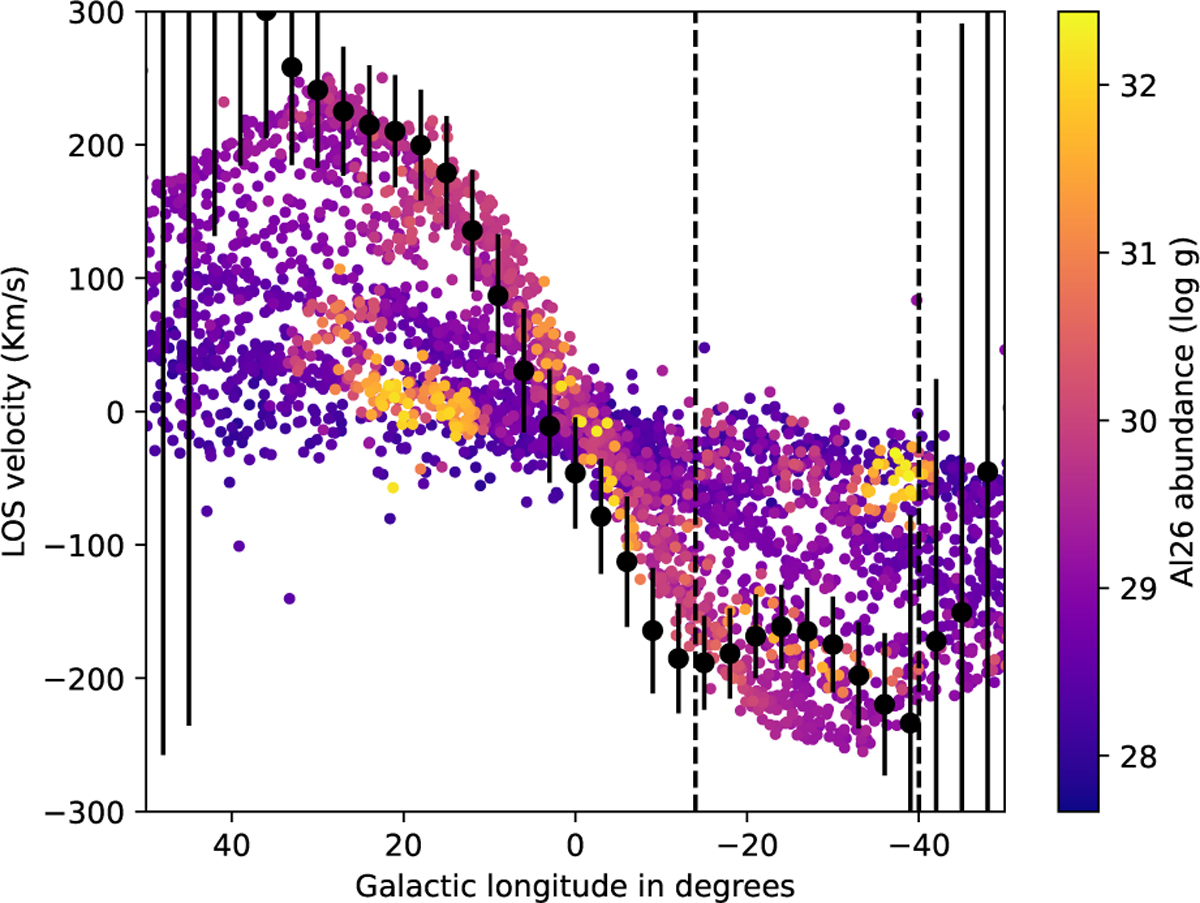
26Al-longitude-LoS velocity diagram of the same disk gas particles of Figure 2, as seen from the location of the Solar System (i.e., the red circle in Figure 2), color-coded according to their 26Al content (in log (gram) unit). Black dots with error bars show the 26Al detection data by the INTEGRAL/SPI instrument (Kretschmer et al. 2013) and Karsten Kretschmer, personal communication. The dashed vertical lines highlight the region between the viewing angle −40 ≤ ϕ ≤ −14, corresponding to the dashed lines in Figure 2, showing the deviation discussed in the text.
Current usage metrics show cumulative count of Article Views (full-text article views including HTML views, PDF and ePub downloads, according to the available data) and Abstracts Views on Vision4Press platform.
Data correspond to usage on the plateform after 2015. The current usage metrics is available 48-96 hours after online publication and is updated daily on week days.
Initial download of the metrics may take a while.