Fig. 6.
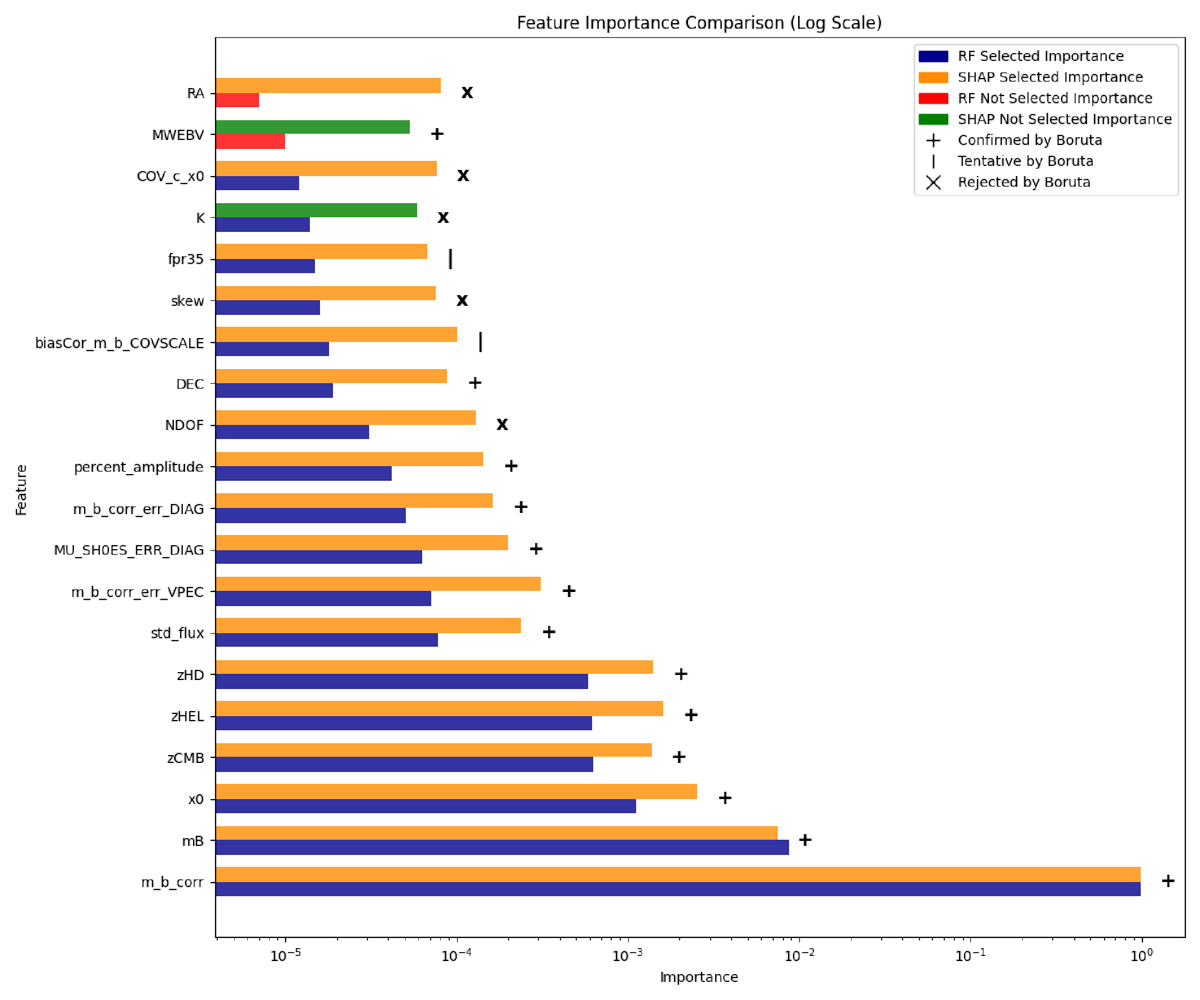
Download original image
Feature importance comparison. Dark blue bars show the importance of features selected by the random forest model, and dark orange bars the importance of features selected by SHAP. Red bars represent the importance of features not selected by the random forest model, and green bars the importance of features not selected by SHAP. The symbols indicate the Boruta classification: + for confirmed, | for tentative, and x for rejected features. More information on all features (Pantheon+SH0ES dataset and additions) can be found in the appendix.
Current usage metrics show cumulative count of Article Views (full-text article views including HTML views, PDF and ePub downloads, according to the available data) and Abstracts Views on Vision4Press platform.
Data correspond to usage on the plateform after 2015. The current usage metrics is available 48-96 hours after online publication and is updated daily on week days.
Initial download of the metrics may take a while.