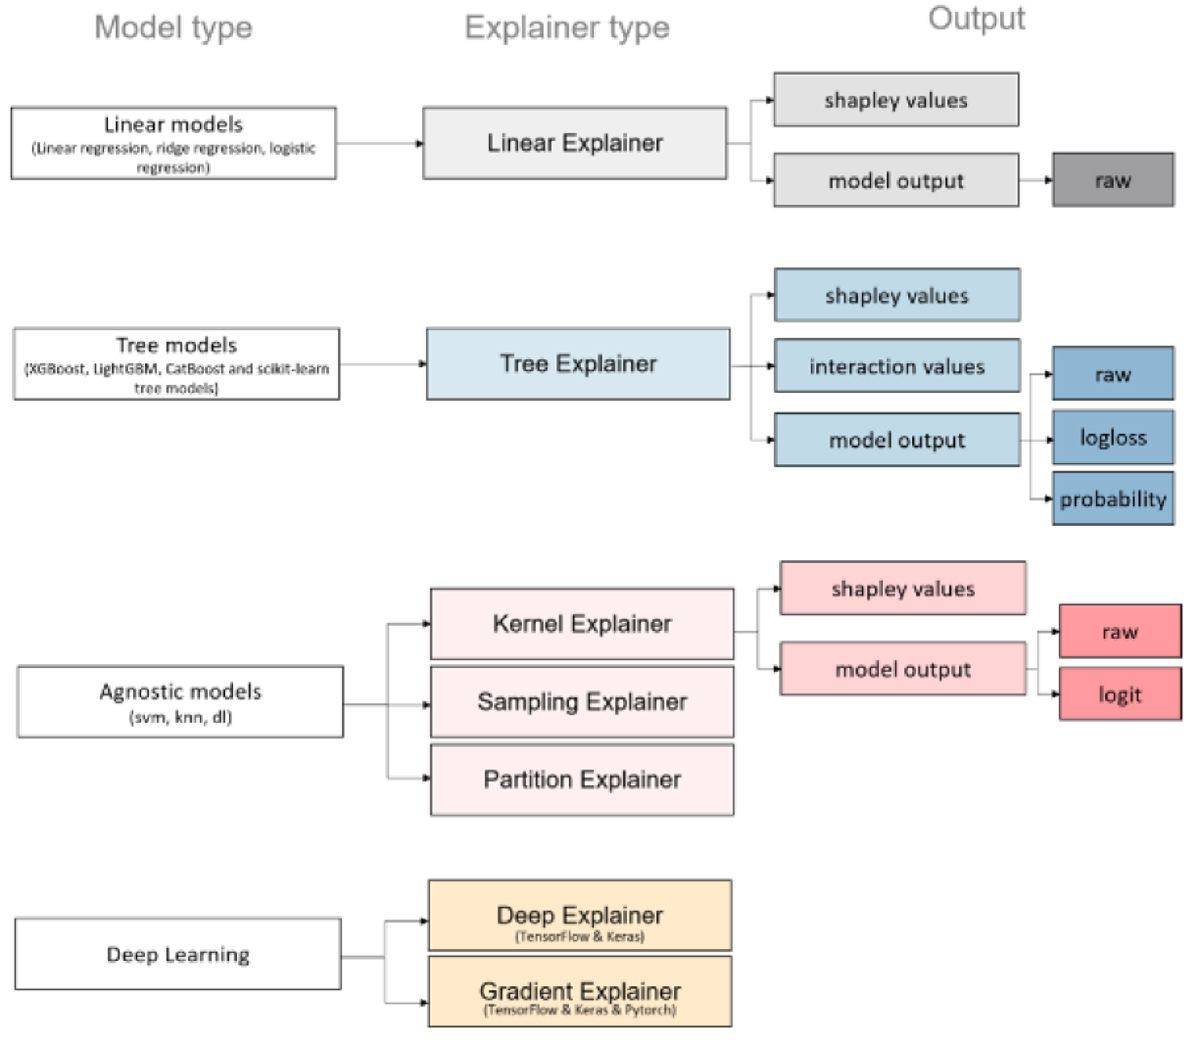
Fig. 2.
Download original image
Types of explainers (Czerwinska 2020). Panel a: Sum of a row of matrices (features by features) equals the SHAP value of this feature and this sample. Panel b: Diagonal entries equal the main effect of this feature on the prediction. Panel c: Symmetrical entries out of the diagonal equal the interaction effect between all the pairs of features for a given sample.
Current usage metrics show cumulative count of Article Views (full-text article views including HTML views, PDF and ePub downloads, according to the available data) and Abstracts Views on Vision4Press platform.
Data correspond to usage on the plateform after 2015. The current usage metrics is available 48-96 hours after online publication and is updated daily on week days.
Initial download of the metrics may take a while.