Fig. 4.
Download original image
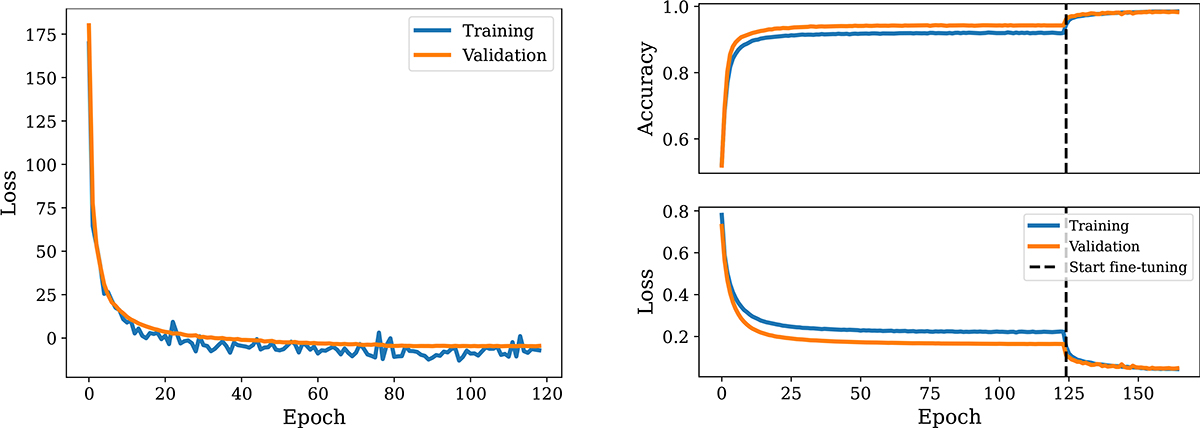
Loss and accuracy curves over training epochs for the VariLens model. The left panel shows optimizations for the physics-informed VAE, while the right panel displays the one for the classifier module. The metrics, evaluated on the training and validation datasets, are depicted by the blue and orange lines, respectively. For the classifier, the dashed black line indicates the epoch when network fine-tuning begins. Prior to fine-tuning, the VariLens classifier appeared to perform worse on the training dataset compared to the validation samples. This could be due to the model not having fully converged or found the optimal weights at that stage.
Current usage metrics show cumulative count of Article Views (full-text article views including HTML views, PDF and ePub downloads, according to the available data) and Abstracts Views on Vision4Press platform.
Data correspond to usage on the plateform after 2015. The current usage metrics is available 48-96 hours after online publication and is updated daily on week days.
Initial download of the metrics may take a while.