Fig. 2
Download original image
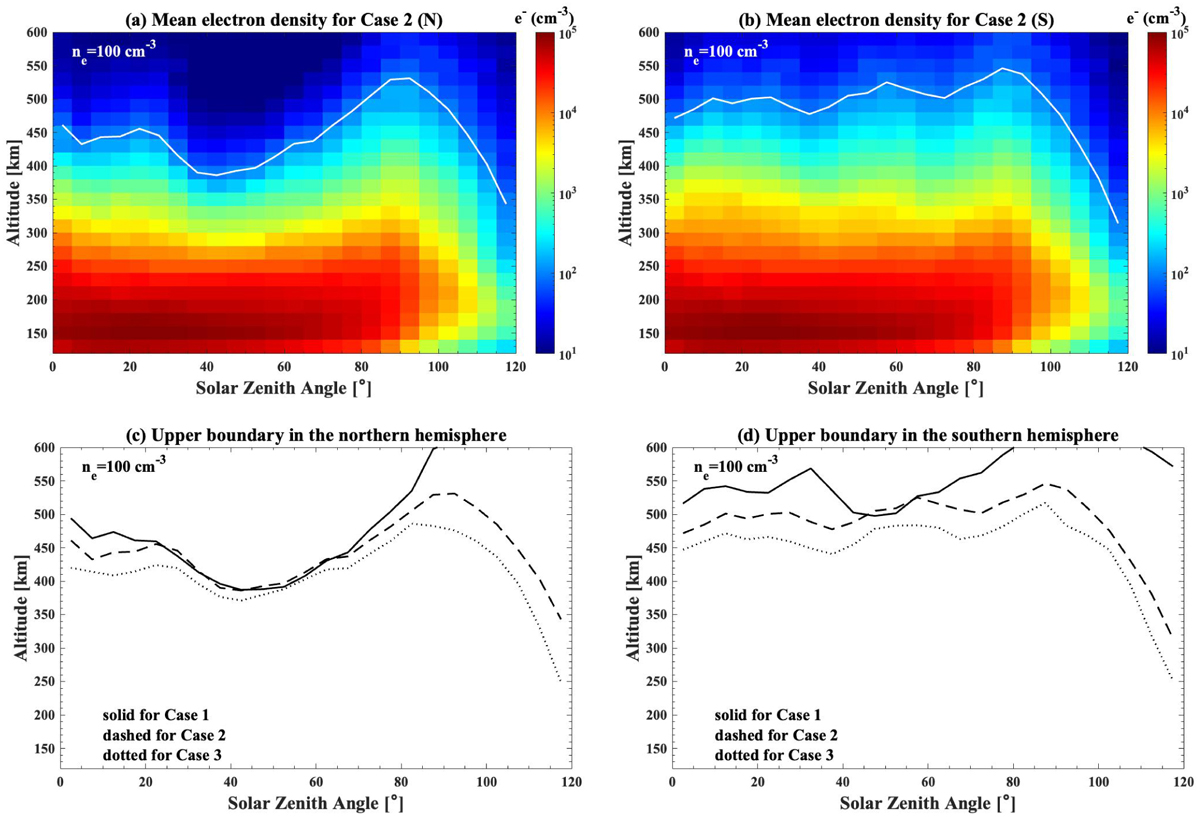
Ionospheric upper boundary for different SZA range. Panels a and b show the mean electron density of the Martian ionosphere for an SZA range of 0°–120° and an altitude range of 120–600 km. The white line in each panel marks the altitudes that the electron density ne is equal to 100 cm−3. Panel c and d show the ionospheric upper boundary, with the solid dashed and dotted line representing the boundary of Case 1,2, and 3. The results are exhibited separately in the northern (left panels) and southern (right panels) hemispheres.
Current usage metrics show cumulative count of Article Views (full-text article views including HTML views, PDF and ePub downloads, according to the available data) and Abstracts Views on Vision4Press platform.
Data correspond to usage on the plateform after 2015. The current usage metrics is available 48-96 hours after online publication and is updated daily on week days.
Initial download of the metrics may take a while.