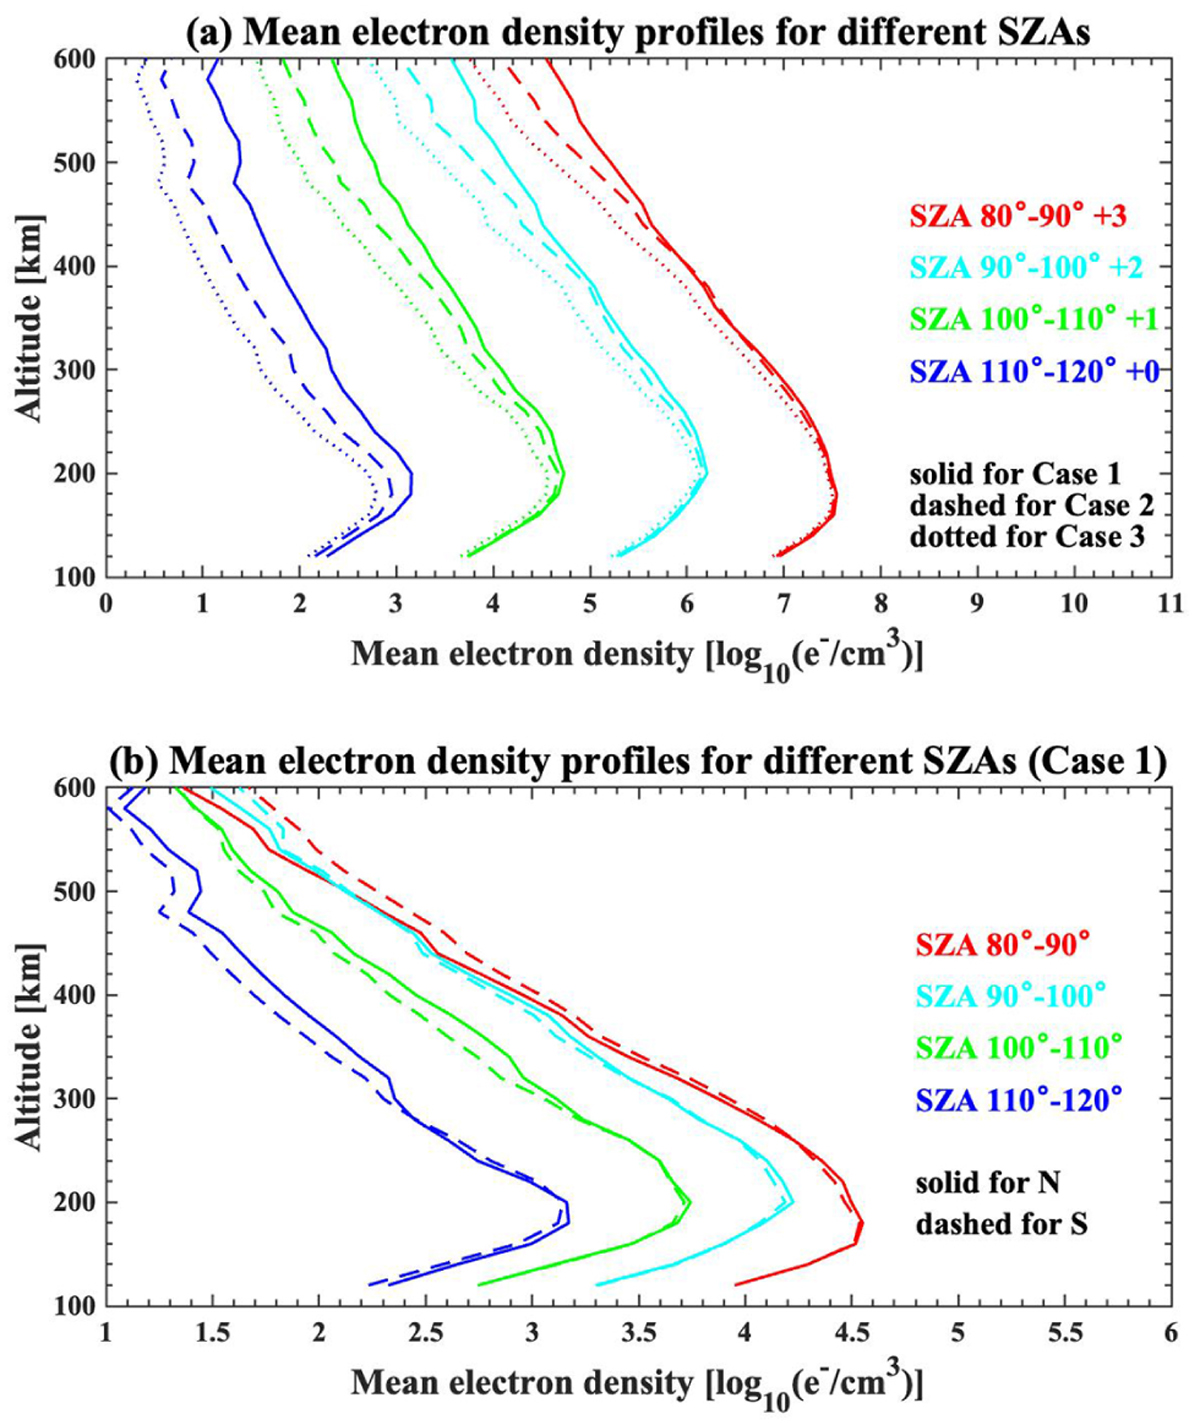
Fig. 1
Download original image
Mean electron density profiles for different SZA range in the terminator region. Panels a shows the averaged electron density profiles, with the solid, dashed, and dotted lines representing profiles of the |IMF| = 1 nT case, |IMF| = 3 nT case, and |IMF| = 5 nT case, respectively. Panel b shows the averaged electron density profiles for the |IMF| = 3 nT case. Here, the solid and dashed lines represent profiles of the northern and southern hemispheres. The profiles are shifted on the x-axis by the amounts marked in the figure.
Current usage metrics show cumulative count of Article Views (full-text article views including HTML views, PDF and ePub downloads, according to the available data) and Abstracts Views on Vision4Press platform.
Data correspond to usage on the plateform after 2015. The current usage metrics is available 48-96 hours after online publication and is updated daily on week days.
Initial download of the metrics may take a while.