| Issue |
A&A
Volume 694, February 2025
|
|
|---|---|---|
| Article Number | A300 | |
| Number of page(s) | 6 | |
| Section | Cosmology (including clusters of galaxies) | |
| DOI | https://doi.org/10.1051/0004-6361/202452970 | |
| Published online | 20 February 2025 | |
J1721+8842: The first Einstein zigzag lens
1
European Southern Observatory, Alonso de Córdova 3107, Vitacura, Santiago, Chile
2
Institute of Physics, Laboratory of Astrophysics, Ecole Polytechnique Fédérale de Lausanne (EPFL), Observatoire de Sauverny, 1290 Versoix, Switzerland
3
Kavli Institute for Particle Astrophysics and Cosmology and Department of Physics, Stanford University, Stanford, CA 94305, USA
4
Institute for Particle Physics and Astrophysics, ETH Zurich, Wolfgang-Pauli-Strasse 27, CH-8093 Zurich, Switzerland
5
Oskar Klein Centre, Department of Physics, Stockholm University, SE-106 91 Stockholm, Sweden
6
UCLA Physics & Astronomy, 475 Portola Plaza, Los Angeles, CA 90095-1547, USA
7
Institut de Ciències del Cosmos, Universitat de Barcelona, Martí i Franquès, 1, E-08028 Barcelona, Spain
8
ICREA, Pg. Lluís Companys 23, Barcelona E-08010, Spain
9
Department of Astronomy & Astrophysics, University of Chicago, Chicago, IL 60637, USA
10
Kavli Institute for Cosmological Physics, University of Chicago, Chicago, IL 60637, USA
11
Department of Physics and Astronomy, Stony Brook University, Stony Brook, NY 11794, USA
12
Research Center for the Early Universe, Graduate School of Science, The University of Tokyo, 7-3-1 Hongo, Bunkyo-ku, Tokyo 113-0033, Japan
13
DARK, Niels Bohr Institute, University of Copenhagen, Jagtvej 155A, DK-2200 Copenhagen N, Denmark
14
STFC Hartree Centre, Sci-Tech Daresbury, Keckwick Lane, Daresbury, Warrington WA4 4AD, UK
15
Universidad Andres Bellos, Fernández Concha 700, Av. Las Condes alt. 13.350, Las Condes, Santiago, Chile
16
Technical University of Munich, TUM School of Natural Sciences, Physics Department, James-Franck-Straße 1, 85748 Garching, Germany
17
Max-Planck-Institut für Astrophysik, Karl-Schwarzschild Straße 1, 85748 Garching, Germany
18
Dipartimento di Fisica, Università degli Studi di Milano, Via Celoria 16, I-20133 Milano, Italy
19
INAF – IASF Milano, Via A. Corti 12, I-20133 Milano, Italy
20
STAR Institute, University of Liège, Quartier Agora, Allée du Six Août 19c, 4000 Liège, Belgium
⋆⋆ Corresponding author; This email address is being protected from spambots. You need JavaScript enabled to view it.
.
Received:
12
November
2024
Accepted:
15
January
2025
Abstract
We report the discovery of the first example of an Einstein zigzag lens, an extremely rare lensing configuration. In this system, J1721+8842, six images of the same background quasar are formed by two intervening galaxies, one at redshift z1 = 0.184 and another at z2 = 1.885. Two out of the six multiple images are deflected in opposite directions as they pass the first lens galaxy on one side and the second on the other side – the optical paths forming zigzags between the two deflectors. In this paper we demonstrate that J1721+8842, previously thought to be a lensed dual quasar, is in fact a compound lens, with the more distant lens galaxy also being distorted as an arc by the foreground galaxy. Evidence supporting this unusual lensing scenario includes: (1) identical light curves in all six lensed quasar images obtained from two years of monitoring at the Nordic Optical Telescope; (2) detection of the additional deflector at redshift z2 = 1.885 in JWST/NIRSpec integral field unit data; and (3) a multiple-plane lens model reproducing the observed image positions. This unique configuration offers the opportunity to combine two major lensing cosmological probes, time-delay cosmography and dual source-plane lensing, since J1721+8842 features multiple lensed sources that form two distinct Einstein radii of different sizes, one of which is a variable quasar. We expect to place tight constraints on H0 and w by combining these two probes of the same system. The z2 = 1.885 deflector, a quiescent galaxy, is also the highest-redshift strong galaxy-scale lens with a spectroscopic redshift measurement known to date.
Key words: galaxies: evolution / cosmological parameters / cosmology: observations / dark energy / distance scale
Co-first authors.
NHFP Einstein Fellow.
© The Authors 2025
 Open Access article, published by EDP Sciences, under the terms of the Creative Commons Attribution License (https://creativecommons.org/licenses/by/4.0), which permits unrestricted use, distribution, and reproduction in any medium, provided the original work is properly cited.
This article is published in open access under the Subscribe to Open model. This email address is being protected from spambots. You need JavaScript enabled to view it. to support open access publication.
1. Introduction
Strong gravitational lensing is a powerful tool for measuring distances and ratios of distances in the Universe (Refsdal 1964). To date, two main methods have provided the most stringent constraints on cosmological parameters. The first, time-delay cosmography, uses the time delay between the arrival of different images of a variable lensed source (typically quasars or supernovae) to infer the time-delay distance (i.e. a ratio of distances) to the lens, to the source, and between the lens and the source (see e.g. Birrer et al. 2024, for a review). From these time-delay distance measurements, the COSMOGRAIL, H0LiCOW, SHARP, STRIDES, and TDCOSMO collaborations have achieved a 2 to 8% measurement of the Hubble constant (H0), depending on the assumptions made to describe the mass profile of the deflector galaxy (Chen et al. 2019; Wong et al. 2020; Birrer et al. 2020; Millon et al. 2020; Shajib et al. 2020). The first discovered cases of supernovae lensed by galaxy clusters also allowed a 6% (Kelly et al. 2023; Grillo et al. 2024) and an 11% (Pascale et al. 2024) determination of H0; the search for a galaxy-scale lens of a supernova suitable for time-delay cosmography is still ongoing.
The second method uses double source-plane lenses (DSPLs). This method leverages rare lensing configurations in which two background objects are lensed by the same foreground galaxy, forming two Einstein rings of different radii (Gavazzi et al. 2008). The ratio of the two radii is proportional to ratios involving distances to the two sources and between the lens and the sources (see e.g. Collett et al. 2012, for details). These distance ratios are not sensitive to H0 but constrain the expansion history of the Universe and, thus, can provide competitive measurements of the matter density parameter, Ωm, and the dark energy equation of state parameter, w (Collett & Auger 2014; Linder 2016). Although the presence of multiple background sources is common for galaxy clusters, this information is needed to infer their complex mass distribution, which reduces the precision on the cosmological parameters (e.g. Jullo et al. 2010; Caminha et al. 2022; Bolamperti et al. 2024). In contrast, galaxy-scale lenses tend to be very well fitted with simple mass distributions (e.g. Shajib et al. 2021; Sheu et al. 2024), but galaxy-scale DSPLs are unfortunately extremely rare. Only six systems have been spectroscopically confirmed to date (Gavazzi et al. 2008; Tu et al. 2009; Tanaka et al. 2016; Schuldt et al. 2019; Lemon et al. 2023; Bolamperti et al. 2023), although several dozen should be found in wide-field surveys such as the Vera Rubin LSST or Euclid (Sharma et al. 2023). Until more galaxy-scale DSPLs are found, this probe will remain limited by statistical errors due to the small sample size.
Here, we present a unique case of galaxy-scale strong lensing, J1721+8842. It was originally discovered as a quadruply imaged source at redshift zs = 2.38 by Lemon et al. (2018) using Gaia and Pan-STARRS and was subsequently interpreted as a lensed dual active galactic nucleus in Lemon et al. (2022) and Mangat et al. (2021) due to the presence of two additional images in follow-up data (labelled E and F in Fig. 1). We demonstrate in this paper that these six images all originate from the same background quasar, a situation made possible by another deflector at redshift z2 = 1.885 in addition to the known lens at redshift z1 = 0.184. This second deflector, contoured in white in Fig. 1, was previously mistaken for a source galaxy at the same redshift as the quasar, from which the black holes may have been ejected in a post-merger scenario (Mangat et al. 2021). Since the more distant deflector is also lensed into a partial Einstein ring, J1721+8842 qualifies as both a DSPL and a time-delay lens. This exceptional system provides a unique opportunity to combine the two major strong lensing probes mentioned above.
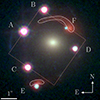 |
Fig. 1. HST/WFC31 composite image (F160W, F814W, F475X) of J1721+8842. The six lensed point images of the background quasar are labelled with letters. The red lensed arc, previously believed to be the host galaxy of a second source quasar, is highlighted in white. This arc is actually an additional deflector at an intermediate redshift, which is itself lensed by the central foreground galaxy in the image. The dotted red square indicates the footprint of the JWST/NIRSpec observation that enabled the measurement of the arc’s redshift. |
In this paper we present evidence from the light curves obtained at the Nordic Optical Telescope (NOT), new redshift measurements from the James Webb Space Telescope (JWST) Near InfraRed Spectrograph (NIRSpec), and updated lens models, which unambiguously confirm the scenario that one single source is lensed in J1721+8842. Full lens models, time-delay measurements, and cosmology constraints derived from this system will be published in follow-up papers as part of the TDCOSMO collaboration (Schmidt et al., in prep.; Dux et al., in prep.; Millon et al., in prep.).
Throughout this work, we adopt a flat Λ cold dark matter cosmology with H0 = 70 km s−1 Mpc−1 and Ωm = 0.3.
2. Evidence of single source lensing
2.1. Identical light curves
J1721+8842 was imaged daily in the r band for two full years at the NOT, from February 2021 to August 2023. It is circumpolar and therefore can be continuously monitored at the latitude of NOT. The general observation strategy and data reduction will be described in an upcoming paper, together with more targets monitored at the same facility. After the completion of the observations, the suspicion that J1721+8842 is in fact a single quasar arose from the light curves of the E and F lensed images, which match those of A, B, C, and D (see Fig. 1 for the labelling of the lensed images). For illustration, the D and E curves, shown in Fig. 2, display the same variations with a ∼35-day offset. This non-zero delay rules out extraction systematics, which would cause simultaneous variations. This similarity contradicts the dual quasar hypothesis, in which the curves would be uncorrelated: if two quasars were present in the source plane, they would be separated by at least 6 kpc (Lemon et al. 2022), and thus it is impossible that one active galactic nucleus would trigger a correlated emission in the second one.
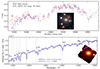 |
Fig. 2. Evidence of the unique source and double lens nature of J1721+8842. Top: NOT light curves of the D and E lensed images of J1721+8842. The inset is a colour-composite HST/WFC3 image of the system with the lensed components labelled. The two light curves are identical within their noise envelope, with D preceding E by about 35 days. Bottom: JWST/NIRSpec spectrum of the far deflector arced by the foreground lens. The spectrum was extracted from the mask drawn on the inset, which itself is a single slice of the NIRSpec cube. The redshift was determined from the overlaid absorption lines. Note that the total flux presented here is the one observed, not corrected for the magnification due to lensing. |
However, there might remain a possibility that two independently varying quasars could show variations matching within their noise envelopes, even though the odds seem slim over a long baseline. To assess these odds, we generated a million mocks for which we calculated the best correlation with the D curve with time shifts between −100 and +100 days. In doing so, we assumed that the variability of both quasars could be modelled with Ornstein-Uhlenbeck processes, the parameters of which (correlation time τ and volatility σ) were fitted on the D curve. The best attained correlation was 0.91, translating to a resemblance of low-frequency features, whereas D and E have a correlation of 0.95, with even high-frequency features matching. Thus, we failed to find a properly matching curve in one million draws. To assess how many mocks it would take to match even the higher-frequency features, we considered two identical Ornstein-Uhlenbeck processes initially differing by a value within the noise envelope σm. By analysing the difference between their states after a time step Δt, we determined that this difference follows a Gaussian distribution with zero mean and variance  . Using the cumulative distribution function of the normal distribution, Φ, we calculated the probability that the two processes remain within the noise envelope after Δt days:
![Mathematical equation: $$ \begin{aligned} \mathcal{P} =\frac{1}{2\Phi (1)-1} \left[ 2\Phi \left(\frac{\sigma _{m}}{\sqrt{2(\Delta t\sigma ^{2}+\left(\frac{\Delta t}{\tau }\right)^2\sigma _{m}^{2})}}\right)-1 \right]. \end{aligned} $$](/articles/aa/full_html/2025/02/aa52970-24/aa52970-24-eq2.gif) (1)
(1)
We multiplied this probability for a succession of time lags, Δt, until we reached the length of the light curves. We took Δt ∼ 40 days as the size of the smallest clearly captured features, and we find the probability of observing two identical light curves from two independent quasars over this baseline to be about 10−12. This is assuming the Δt ∼ −35 days delay required for matching the two curves, but the existence of a delay is expected regardless of the scenario, with moreover all six curves matching in a similar way with time shifts only. Furthermore, this all neglects the odds of two independent quasars having the same variability parameters. Overall, both numerical and analytical approaches indicate vanishing odds of two quasars producing light curves this similar over the 700 days monitoring baseline.
2.2. Redshift of the red lensed arc
Lemon et al. (2018) first confirmed the four bright images (A, B, C, and D) to be at a redshift of 2.38, and subsequent long-slit spectroscopy confirmed image E to be at the same redshift, though the signal-to-noise ratio did not allow a clear comparison of the spectral features (Lemon et al. 2022). Image F was not directly measured, but was assumed to be the counter-image of E. We note that these analyses were done solely on ground-based imaging, and thus the arc seen in subsequent Hubble Space Telescope (HST) imaging (contoured in white in Fig. 1) was not used to conclude the dual-source nature of the system. Mangat et al. (2021) did use the HST imaging and suggested that the arc was another source galaxy, located at the same redshift as the quasar. These authors noticed that the centre position of this galaxy did not match with the position of any of the quasars and proposed the hypothesis that the quasars were recoiling black holes, ejected from their host galaxy after a merger. No redshift for the arc had been reported, and all previous lens modelling assumed a single lens plane.
Thanks to a recent, deep JWST/NIRSpec (Jakobsen et al. 2022) observation2, this hypothesis could finally be tested. The footprint of the JWST/NIRSpec observation is shown in Fig. 1, with a part of the red arc falling into the field of view. The extracted spectrum of the arc, and its extraction aperture on a slice of the NIRSpec cube, are displayed in the bottom part of Fig. 2. The spectrum features Balmer absorption lines that make a redshift determination straightforward: z2 = 1.885 ± 0.0013. This is incompatible with the redshift of the background quasar, which can also be determined from the NIRSpec data: zF ∼ 2.382 ± 0.002, in agreement with the results of Lemon et al. (2022). Therefore, rather than being the host galaxy of a second quasar, the arc is due to a separate galaxy, lensed by the foreground deflector at z1 = 0.184, and itself acting as a lens for the quasar light. At redshift z2 = 1.885, this is the highest redshift spectroscopically confirmed galaxy-scale lens known, breaking the previous record of z = 1.62, for a galaxy embedded in a cluster (Wong et al. 2014). Its redshift is also comparable to that of the lens found by van Dokkum et al. (2023), although only a photometric redshift (z = 2.02 ± 0.02; Mercier et al. 2024) has been obtained for this system.
2.3. Lens model
Original models published by Schmidt et al. (2023) and Ertl et al. (2023) assumed two quasars in the source plane, and modelled the lensed arcs as one of the quasar host galaxies at redshift zs = 2.38. However, Schmidt et al. (2023) observed some unexpectedly large astrometric errors for this system whereas Ertl et al. (2023) noted an offset between the quasar position and its host galaxy. This offset was also noticed in the models by Mangat et al. (2021). In light of the new redshift measurement from the JWST/NIRSpec observations, we updated the lenstronomy (Birrer & Amara 2018; Birrer et al. 2021) model of Schmidt et al. (2023), adding this additional perturber at redshift z2 = 1.885. The updated multi-plane lens model, fitted on the pixels of the three HST/WFC3 bands shown in Fig. 1, reproduces the positions of the six lensed images, matching the astrometry measured from HST imaging with a root-mean-square error of 0.03″. The model includes a power-law elliptical mass distribution (with a core radius fixed to a very small value and six free parameters) at z1 = 0.184 to describe the foreground lensing galaxy, a singular isothermal sphere (three free parameters) at z2 = 1.885, and external shear in the z = 0.184 plane (two free parameters). Additionally, we included four galaxies located between 10″ and 33″ from the optical axis that are visible in the HST images. These perturbers do not have spectroscopic redshift measurements, but, given their colour in the HST images, we assumed that they are located in the z1 = 0.184 lens plane. They are modelled as singular isothermal sphere profiles at fixed positions, with fitted velocity dispersions ranging from 117 to 310 km/s, and have little impact on the total convergence. Moreover, the light profiles of the sources are parametrised with shapelets, which add a few dozen parameters, and the light of the main lens is represented by a double Sérsic profile. Overall, our model has more parameters than constraints that could be obtained from astrometry alone, which is why fitting the HST pixels directly was required. In Fig. 3 we show the magnification map of our lens model, alongside the predicted and observed image positions and the optical paths taken by each lensed image. Both the ABCD quartet and the EF doublet are initially deflected by the z2 = 1.885 deflector, yet they still form two separate and compact groups of light rays at this redshift. Moreover, the two groups are separated by 0.7″, which translates to a separation of 6 kpc, matching the reported distance between the two initially postulated quasar sources. Thus, not only does the model reproduce the observational data, but it also qualitatively explains how, under to the former hypothesis, two sources could be fitted so well with a single deflector.
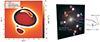 |
Fig. 3. Our best mass model of J1721+8842. Left: Magnification map from the z = 2.382 plane. Critical lines in the lens plane are shown in red, while the corresponding inner caustics in the source plane are represented in green. The predicted positions of the images from our model (blue crosses) reproduce the observed image positions (black circles with size proportional to the image’s magnification). The quasar’s position in the source plane is indicated with a star. Right: Visualisation of the optical paths of the lensed images. The two zigzag paths, D and F, are marked in pink and blue, respectively. The deflectors cause two sets of sharp turns, while the smooth curvature seen in all paths is due to the expansion of space. |
3. Discussion
To our knowledge, the formation of six multiple images of the same background source has never been observed in galaxy-scale strong lenses. However, this lensing configuration was originally studied by Kochanek & Apostolakis (1988) and (Erdl & Schneider 1993, see also Möller & Blain 2001; Werner et al. 2008). In a more recent study, Collett & Bacon (2016) predict that such systems could form ‘only if the second lens is multiply imaged by the first and the Einstein radius of the second lens is comparable to, but does not exceed that of the first’. J1721+8842 fulfils these two conditions, as it is clear from the HST images that the more distant deflector is doubly imaged, with the main arc visible in the vicinity of image F and a counter-image close to image E. In addition, the Einstein radius of this deflector, inferred from our lens model, is θE, 2 = (0.359 ± 0.014)″, or (3.02 ± 0.12) kpc, translating to a total enclosed mass of M2 = (2.31 ± 0.19)⋅1011 M⊙. This makes the more distant deflector slightly less massive than the foreground one, whose Einstein radius is θE, 1 = (1.744 ± 0.013)″, or (5.39 ± 0.04) kpc, corresponding to a total enclosed mass of M1 = (2.74 ± 0.04)⋅1011 M⊙.
The ray tracing of the multiple images, illustrated in the right panel of Fig. 3, reveals the zigzag formed by the two deflectors: image F passes by the far deflector on one side, then is refocused by the foreground galaxy as it passes it on its other side. Image D also experiences two deflections in opposite directions.
Additionally, the DSPL nature of this system, with two source planes and six measured time delays, might also partially lift the mass-sheet degeneracy (MSD; Falco et al. 1985; Schneider & Sluse 2013), which currently is the main source of uncertainties in time-delay cosmography analyses. In recent works (e.g. Birrer et al. 2020; Shajib et al. 2023), a distinction has been made between the external MSD, attributed to the net lensing effect of line-of-sight structures around the main lens – constrained by galaxy number counts (e.g. Rusu et al. 2017; Wells et al. 2023) or weak lensing analysis (Tihhonova et al. 2018, 2020) – and the internal MSD, interpreted as a subtle change of slope in the mass profile of the lensing galaxy, possibly due to the presence of a cored dark matter component (see Blum et al. 2020; Blum & Teodori 2024, for details). The internal MSD parameter, λint, can be constrained with a measurement of the stellar kinematics of the lensing galaxy, ideally spatially resolved, which provides a second estimate of its mass profile. Although the MSD can be generalised for DSPLs (Schneider 2014, 2019), it requires a very specific transformation in both lens planes to maintain an exact degeneracy leaving the lensing observables unchanged. According to Schneider (2014), the effect of a cored profile for the first deflector (λint, 1 < 1) – equivalent to a positive convergence mass sheet – requires a mass sheet in the second lens plane with negative convergence (λint, 2 > 1) to rescale only the time delays, and thus H0, while leaving other lensing observables unaffected by this transformation. Although this is mathematically possible, such a combination of positive and negative mass sheets lacks a clear physical interpretation, as the model proposed by Blum & Teodori (2024) would require some very specific fine-tuning of its redshift dependence to produce alternating cored and cusp profiles. The hypothesis made by recent hierarchical Bayesian analysis (Birrer et al. 2020) that a population of lenses should share common properties for their mass profile (i.e. λint is drawn from a parent distribution common to all lensing galaxies, Birrer et al. 2020) might also break the double-source plane equivalent of the MSD. Two mass sheets with opposite sign would be disfavoured under the aforementioned hypothesis. Whether all the available data can constrain both H0 and w simultaneously, even when considering maximally degenerate lensed models is left for the future modelling and cosmology papers on this lens.
Collett & Bacon (2016) calculated the optical depth for such compound lensing events for varying source redshifts and for each number of images, finding the probability of six-image systems at z > 2 to be ∼10−8. This means that such an Einstein zigzag lens occurs once in 100 million lines of sight. Comparing to the approximate optical depth of multiple lensing of quasars – ∼10−3.3 found by systematic lensed quasar searches (Oguri et al. 2012) – suggests that 1 in 50 000 lensed quasars should be a zigzag lens; however, only ∼300 lensed quasars are known (Lemon et al. 2023). This naive approximation does not account for magnification bias, and further if we consider the optical depth to a compound lens with any number of images, the probability increases by a factor of 100. Given that recent large sky surveys have now imaged several billions of galaxies, it is not surprising that such a system has been found, especially when considering that the high magnification of the multiple images (ranging from 14 to 19 for images A, B, and C) has made its detection easier.
4. Conclusion
We have shown that J1721+8842 is not a lensed dual quasar as previously suggested, but rather a single quasar imaged six times by the combined gravitational deflections of two galaxies: one at z1 = 0.184 and another at z2 = 1.885. This scenario is consistent with all available data: identical light curves in all lensed images, a lens model that reproduces the HST images, and the detection of an additional deflector, itself lensed, from JWST/NIRSpec spectroscopy. This image configuration is extremely rare, with the optical path of two images, D and F, forming a zigzag between the two deflectors. This is the first known example of an Einstein zigzag lens.
The source quasar of J1721+8842 has a proximate damped Lyman-α (PDLA) system, which only about 1 in 3000 quasars have (Finley et al. 2013; Lemon et al. 2022). This characteristic, combined with its lensing configuration, will allow us to probe the PDLA along six different lines of sight, offering the possibility to study these rare systems on sub-parsec scales.
In addition, we report that the lens at z2 = 1.885 is quiescent: its spectrum shows the presence of neutral hydrogen gas absorption lines, but none of the emission lines typical of star formation. The absorption Balmer lines, CaII H & K bands, the CH G band, and the Mg triplet, together with the absence of emission lines, suggest that the deflector is a quenched galaxy or is experiencing ongoing quenching activity. Overall, this deflector is similar in nature and redshift to that found by van Dokkum et al. (2023) and Mercier et al. (2024). A precise mass model of J1721+8842 can answer questions about the compactness of this z2 = 1.885 lens, its dark matter fraction, and other questions studied by van Dokkum et al. (2023).
Finally, the source galaxy of J1721+8842 hosts a variable active galactic nucleus and is the most northern gravitational lens known, which enables continuous monitoring from the ground and has made the time-delay measurements between all six images possible. This system is therefore valuable for future H0 measurement through time-delay cosmography, where high-redshift lenses are known to provide tighter constraints on the cosmological parameters (Paraficz & Hjorth 2009). Its DSPL nature is also advantageous: its lens model can constrain ratios of distances between the observer, the lens, and the two sources, allowing precise measurements of the expansion history of the Universe, with particular sensitivity to the dark energy equation of state. By combining these two strong lensing probes of the same system, it will be possible to probe H0, w, and the mass profile of the higher-redshift deflector, which is of interest for the population of massive galaxies at z ∼ 2.
PI Tommaso Treu, HST proposal ID 15652.
PI Tommaso Treu and Anowar J. Shajib, JWST proposal ID 2974.
Barycentric frame, determined from the Balmer and calcium lines.
Acknowledgments
The first two authors should be regarded as joint first authors. MM acknowledges support by the SNSF (Swiss National Science Foundation) through mobility grant P500PT_203114 and return CH grant P5R5PT_225598. FC acknowledges support from the SNSF and by the European Research Council (ERC) under the European Unions Horizon 2020 research and innovation programme (COSMICLENS: grant agreement No 787886). This project has received funding from the European Union’s Horizon Europe research and innovation programme under the Marie Sklodovska-Curie grant agreement No 101105725. SS has received funding from the European Union’s Horizon 2022 research and innovation programme under the Marie Skłodowska-Curie grant agreement No 101105167 – FASTIDIoUS. SHS thanks the Max Planck Society for support through the Max Planck Fellowship. This research is supported in part by the Excellence Cluster ORIGINS which is funded by the Deutsche Forschungsgemeinschaft (DFG, German Research Foundation) under Germany’s Excellence Strategy – EXC-2094 – 390783311. This work is supported by JSPS KAKENHI Grant Numbers JP24K07089, JP24H00221.AA has been partially supported by the Villum Experiment grant Cosmic Beacons (project number 36225; PIs Agnello, Izzo). This work is based in part on observations made with the NASA/ESA/CSA James Webb Space Telescope. The data were obtained from the Mikulski Archive for Space Telescopes at the Space Telescope Science Institute, which is operated by the Association of Universities for Research in Astronomy, Inc., under NASA contract NAS 5-03127 for JWST. These observations are associated with program #2974. Support for program #2974 was provided by NASA through a grant from the Space Telescope Science Institute, which is operated by the Association of Universities for Research in Astronomy, Inc., under NASA contract NAS 5-03127. This work was supported by research grants (VIL16599, VIL54489) from VILLUM FONDEN. The NOT light curves were extracted with lightcurver (Dux 2024).
References
- Birrer, S., & Amara, A. 2018, Phys. Dark Univ., 22, 189 [Google Scholar]
- Birrer, S., Shajib, A. J., Galan, A., et al. 2020, A&A, 643, A165 [NASA ADS] [CrossRef] [EDP Sciences] [Google Scholar]
- Birrer, S., Shajib, A., Gilman, D., et al. 2021, J. Open Source Softw., 6, 3283 [NASA ADS] [CrossRef] [Google Scholar]
- Birrer, S., Millon, M., Sluse, D., et al. 2024, Space Sci. Rev., 220, 48 [NASA ADS] [CrossRef] [Google Scholar]
- Blum, K., & Teodori, L. 2024, ArXiv e-prints [arXiv:2409.04134] [Google Scholar]
- Blum, K., Castorina, E., & Simonović, M. 2020, ApJ, 892, L27 [Google Scholar]
- Bolamperti, A., Grillo, C., Cañameras, R., Suyu, S. H., & Christensen, L. 2023, A&A, 671, A60 [NASA ADS] [CrossRef] [EDP Sciences] [Google Scholar]
- Bolamperti, A., Grillo, C., Caminha, G. B., et al. 2024, A&A, 692, A239 [NASA ADS] [CrossRef] [EDP Sciences] [Google Scholar]
- Caminha, G. B., Suyu, S. H., Grillo, C., & Rosati, P. 2022, A&A, 657, A83 [NASA ADS] [CrossRef] [EDP Sciences] [Google Scholar]
- Chen, G. C. F., Fassnacht, C. D., Suyu, S. H., et al. 2019, MNRAS, 490, 1743 [NASA ADS] [CrossRef] [Google Scholar]
- Collett, T. E., & Auger, M. W. 2014, MNRAS, 443, 969 [NASA ADS] [CrossRef] [Google Scholar]
- Collett, T. E., & Bacon, D. J. 2016, MNRAS, 456, 2210 [CrossRef] [Google Scholar]
- Collett, T. E., Auger, M. W., Belokurov, V., Marshall, P. J., & Hall, A. C. 2012, MNRAS, 424, 2864 [NASA ADS] [CrossRef] [Google Scholar]
- Dux, F. 2024, J. Open Source Softw., 9, 6775 [NASA ADS] [CrossRef] [Google Scholar]
- Erdl, H., & Schneider, P. 1993, A&A, 268, 453 [NASA ADS] [Google Scholar]
- Ertl, S., Schuldt, S., Suyu, S. H., et al. 2023, A&A, 672, A2 [NASA ADS] [CrossRef] [EDP Sciences] [Google Scholar]
- Falco, E. E., Gorenstein, M. V., & Shapiro, I. I. 1985, ApJ, 289, L1 [Google Scholar]
- Finley, H., Petitjean, P., Pâris, I., et al. 2013, A&A, 558, A111 [NASA ADS] [CrossRef] [EDP Sciences] [Google Scholar]
- Gavazzi, R., Treu, T., Koopmans, L. V. E., et al. 2008, ApJ, 677, 1046 [NASA ADS] [CrossRef] [Google Scholar]
- Grillo, C., Pagano, L., Rosati, P., & Suyu, S. H. 2024, A&A, 684, L23 [NASA ADS] [CrossRef] [EDP Sciences] [Google Scholar]
- Jakobsen, P., Ferruit, P., Alves de Oliveira, C., et al. 2022, A&A, 661, A80 [NASA ADS] [CrossRef] [EDP Sciences] [Google Scholar]
- Jullo, E., Natarajan, P., Kneib, J. P., et al. 2010, Science, 329, 924 [Google Scholar]
- Kelly, P. L., Rodney, S., Treu, T., et al. 2023, Science, 380, abh1322 [NASA ADS] [CrossRef] [Google Scholar]
- Kochanek, C. S., & Apostolakis, J. 1988, MNRAS, 235, 1073 [CrossRef] [Google Scholar]
- Lemon, C. A., Auger, M. W., McMahon, R. G., & Ostrovski, F. 2018, MNRAS, 479, 5060 [Google Scholar]
- Lemon, C., Millon, M., Sluse, D., et al. 2022, A&A, 657, A113 [NASA ADS] [CrossRef] [EDP Sciences] [Google Scholar]
- Lemon, C., Anguita, T., Auger-Williams, M. W., et al. 2023, MNRAS, 520, 3305 [NASA ADS] [CrossRef] [Google Scholar]
- Linder, E. V. 2016, Phys. Rev. D, 94, 083510 [NASA ADS] [CrossRef] [Google Scholar]
- Mangat, C. S., McKean, J. P., Brilenkov, R., et al. 2021, MNRAS, 508, L64 [NASA ADS] [CrossRef] [Google Scholar]
- Mercier, W., Shuntov, M., Gavazzi, R., et al. 2024, A&A, 687, A61 [NASA ADS] [CrossRef] [EDP Sciences] [Google Scholar]
- Millon, M., Galan, A., Courbin, F., et al. 2020, A&A, 639, A101 [NASA ADS] [CrossRef] [EDP Sciences] [Google Scholar]
- Möller, O., & Blain, A. W. 2001, MNRAS, 327, 339 [CrossRef] [Google Scholar]
- Oguri, M., Inada, N., Strauss, M. A., et al. 2012, AJ, 143, 120 [NASA ADS] [CrossRef] [Google Scholar]
- Paraficz, D., & Hjorth, J. 2009, A&A, 507, L49 [NASA ADS] [CrossRef] [EDP Sciences] [Google Scholar]
- Pascale, M., Frye, B. L., Pierel, J. D. R., et al. 2024, ArXiv e-prints [arXiv:2403.18902] [Google Scholar]
- Refsdal, S. 1964, MNRAS, 128, 307 [NASA ADS] [CrossRef] [Google Scholar]
- Rusu, C. E., Fassnacht, C. D., Sluse, D., et al. 2017, MNRAS, 467, 4220 [NASA ADS] [CrossRef] [Google Scholar]
- Schmidt, T., Treu, T., Birrer, S., et al. 2023, MNRAS, 518, 1260 [Google Scholar]
- Schneider, P. 2014, A&A, 568, L2 [NASA ADS] [CrossRef] [EDP Sciences] [Google Scholar]
- Schneider, P. 2019, A&A, 624, A54 [NASA ADS] [CrossRef] [EDP Sciences] [Google Scholar]
- Schneider, P., & Sluse, D. 2013, A&A, 559, A37 [NASA ADS] [CrossRef] [EDP Sciences] [Google Scholar]
- Schuldt, S., Chirivì, G., Suyu, S. H., et al. 2019, A&A, 631, A40 [NASA ADS] [CrossRef] [EDP Sciences] [Google Scholar]
- Shajib, A. J., Birrer, S., Treu, T., et al. 2020, MNRAS, 494, 6072 [Google Scholar]
- Shajib, A. J., Treu, T., Birrer, S., & Sonnenfeld, A. 2021, MNRAS, 503, 2380 [Google Scholar]
- Shajib, A. J., Mozumdar, P., Chen, G. C. F., et al. 2023, A&A, 673, A9 [NASA ADS] [CrossRef] [EDP Sciences] [Google Scholar]
- Sharma, D., Collett, T. E., & Linder, E. V. 2023, JCAP, 2023, 001 [CrossRef] [Google Scholar]
- Sheu, W., Shajib, A. J., Treu, T., et al. 2024, ArXiv e-prints [arXiv:2408.10316] [Google Scholar]
- Tanaka, M., Wong, K. C., More, A., et al. 2016, ApJ, 826, L19 [NASA ADS] [CrossRef] [Google Scholar]
- Tihhonova, O., Courbin, F., Harvey, D., et al. 2018, MNRAS, 477, 5657 [NASA ADS] [CrossRef] [Google Scholar]
- Tihhonova, O., Courbin, F., Harvey, D., et al. 2020, MNRAS, 498, 1406 [NASA ADS] [CrossRef] [Google Scholar]
- Tu, H., Gavazzi, R., Limousin, M., et al. 2009, A&A, 501, 475 [NASA ADS] [CrossRef] [EDP Sciences] [Google Scholar]
- van Dokkum, P., Brammer, G., Wang, B., Leja, J., & Conroy, C. 2023, Nat. Astron., 8, 119 [Google Scholar]
- Wells, P., Fassnacht, C. D., & Rusu, C. E. 2023, A&A, 676, A95 [NASA ADS] [CrossRef] [EDP Sciences] [Google Scholar]
- Werner, M. C., An, J., & Evans, N. W. 2008, MNRAS, 391, 668 [NASA ADS] [CrossRef] [Google Scholar]
- Wong, K. C., Tran, K.-V. H., Suyu, S. H., et al. 2014, ApJ, 789, L31 [NASA ADS] [CrossRef] [Google Scholar]
- Wong, K. C., Suyu, S. H., Chen, G. C. F., et al. 2020, MNRAS, 498, 1420 [Google Scholar]
All Figures
|
Fig. 1. HST/WFC31 composite image (F160W, F814W, F475X) of J1721+8842. The six lensed point images of the background quasar are labelled with letters. The red lensed arc, previously believed to be the host galaxy of a second source quasar, is highlighted in white. This arc is actually an additional deflector at an intermediate redshift, which is itself lensed by the central foreground galaxy in the image. The dotted red square indicates the footprint of the JWST/NIRSpec observation that enabled the measurement of the arc’s redshift. |
| In the text | |
|
Fig. 2. Evidence of the unique source and double lens nature of J1721+8842. Top: NOT light curves of the D and E lensed images of J1721+8842. The inset is a colour-composite HST/WFC3 image of the system with the lensed components labelled. The two light curves are identical within their noise envelope, with D preceding E by about 35 days. Bottom: JWST/NIRSpec spectrum of the far deflector arced by the foreground lens. The spectrum was extracted from the mask drawn on the inset, which itself is a single slice of the NIRSpec cube. The redshift was determined from the overlaid absorption lines. Note that the total flux presented here is the one observed, not corrected for the magnification due to lensing. |
| In the text | |
|
Fig. 3. Our best mass model of J1721+8842. Left: Magnification map from the z = 2.382 plane. Critical lines in the lens plane are shown in red, while the corresponding inner caustics in the source plane are represented in green. The predicted positions of the images from our model (blue crosses) reproduce the observed image positions (black circles with size proportional to the image’s magnification). The quasar’s position in the source plane is indicated with a star. Right: Visualisation of the optical paths of the lensed images. The two zigzag paths, D and F, are marked in pink and blue, respectively. The deflectors cause two sets of sharp turns, while the smooth curvature seen in all paths is due to the expansion of space. |
| In the text | |
Current usage metrics show cumulative count of Article Views (full-text article views including HTML views, PDF and ePub downloads, according to the available data) and Abstracts Views on Vision4Press platform.
Data correspond to usage on the plateform after 2015. The current usage metrics is available 48-96 hours after online publication and is updated daily on week days.
Initial download of the metrics may take a while.