Fig. 3.
Download original image
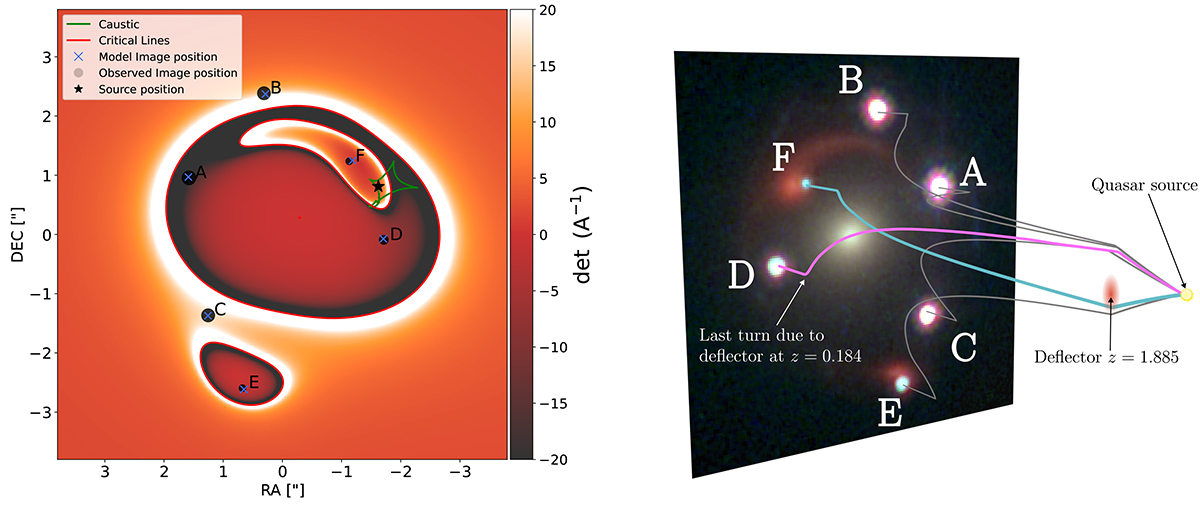
Our best mass model of J1721+8842. Left: Magnification map from the z = 2.382 plane. Critical lines in the lens plane are shown in red, while the corresponding inner caustics in the source plane are represented in green. The predicted positions of the images from our model (blue crosses) reproduce the observed image positions (black circles with size proportional to the image’s magnification). The quasar’s position in the source plane is indicated with a star. Right: Visualisation of the optical paths of the lensed images. The two zigzag paths, D and F, are marked in pink and blue, respectively. The deflectors cause two sets of sharp turns, while the smooth curvature seen in all paths is due to the expansion of space.
Current usage metrics show cumulative count of Article Views (full-text article views including HTML views, PDF and ePub downloads, according to the available data) and Abstracts Views on Vision4Press platform.
Data correspond to usage on the plateform after 2015. The current usage metrics is available 48-96 hours after online publication and is updated daily on week days.
Initial download of the metrics may take a while.