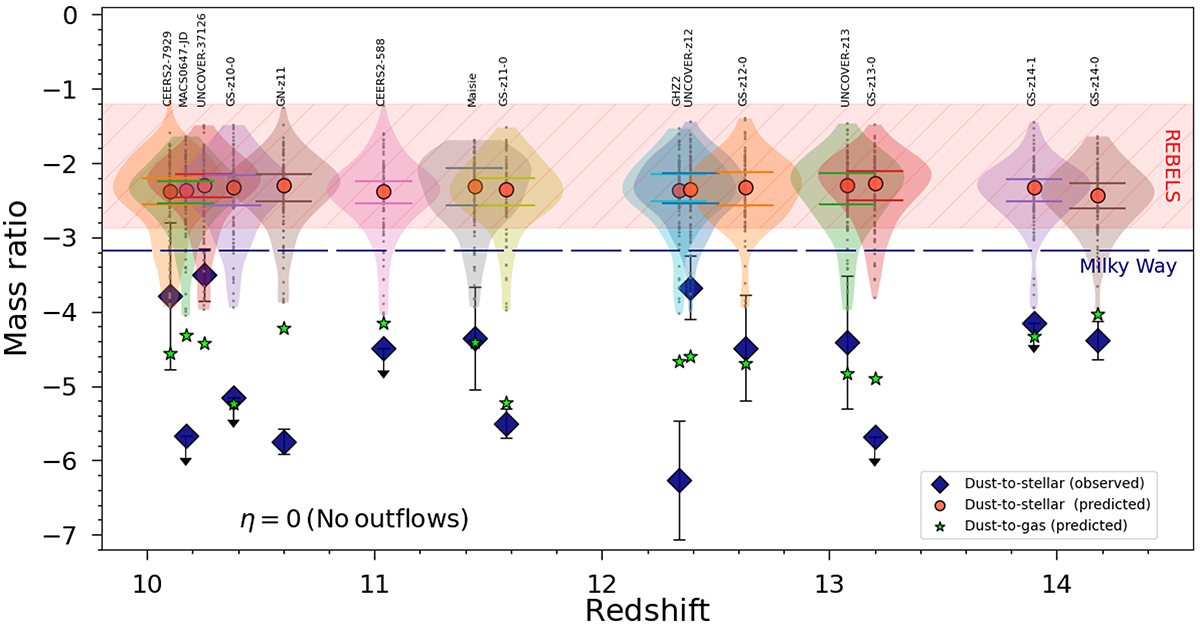
Fig. 2.
Download original image
Violin plots showing the posterior distribution of ξd resulting from the random sampling of the parameter space (see details in Sect. 5) for 15 super-early galaxies whose redshifts is indicated on the horizontal axis and whose name is shown at the top. For each galaxy, the red point represents the distribution median value; the horizontal bars inside the violin indicate the 32nd and 68th percentiles. The predicted ξd values are for η = 0, i.e., when no galactic outflows are allowed. The blue diamonds are the observed dust-to-stellar mass ratios; the green stars are the predicted dust-to-gas ratio, 𝒟. The horizontal hatched red band shows the measured ξd interval for 14 REBELS galaxies at z ≈ 7 (Table 1 in Ferrara et al. 2022; see also Dayal et al. 2022; Sommovigo et al. 2022; Inami et al. 2022).
Current usage metrics show cumulative count of Article Views (full-text article views including HTML views, PDF and ePub downloads, according to the available data) and Abstracts Views on Vision4Press platform.
Data correspond to usage on the plateform after 2015. The current usage metrics is available 48-96 hours after online publication and is updated daily on week days.
Initial download of the metrics may take a while.