| Issue |
A&A
Volume 694, February 2025
|
|
|---|---|---|
| Article Number | A215 | |
| Number of page(s) | 7 | |
| Section | Cosmology (including clusters of galaxies) | |
| DOI | https://doi.org/10.1051/0004-6361/202452368 | |
| Published online | 18 February 2025 | |
ALMA observations of super-early galaxies: Attenuation-free model predictions
1
Scuola Normale Superiore, Piazza dei Cavalieri 7, 56126 Pisa, Italy
2
Leiden Observatory, Leiden University, NL-2300 RA Leiden, Netherlands
3
Observatoire de Genève, 1290 Versoix, Switzerland
4
Cosmic Dawn Center (DAWN), Niels Bohr Institute, University of Copenhagen, Jagtvej 128, København N DK-2200, Denmark
⋆ Corresponding author; This email address is being protected from spambots. You need JavaScript enabled to view it.
Received:
25
September
2024
Accepted:
14
January
2025
Abstract
The abundance and blue color of the super-early (redshift z > 10) luminous galaxies discovered by the James Webb Space Telescope (JWST) can be explained if radiation-driven outflows have ejected their dust on kiloparsec-scales. To test this hypothesis, we predict the Atacama Large Millimeter Array (ALMA) detectability of this extended dust component. Based on the observed properties of the galaxy, its observed continuum flux at 88 μm, F88, depends on the dust-to-stellar mass ratio, ξd, and on the extent of the dust distribution, rd. When this is applied to the most distant known galaxy, GS-z14-0 at z = 14.32, the fiducial model (ξd = 1/529) predicts F88fid = 14.9 μJy and a dust extent rd = 1.4 kpc. If the galaxy is very dust rich (ξd = 1/40), F88max = 40.1 μJy. These values are lower (F88fid = 9.5 μJy) if the dust is predominantly made of large grains such as those that form in supernova ejecta. Forthcoming ALMA observations might come very close to constraining the fiducial predictions of the outflow-based attenuation-free model. Other super-early galaxies are predicted to be fainter at 88 μm, mostly because their star formation rate is lower than that of GS-z14-0, with fiducial fluxes in the range 2 − 5.2 μJy.
Key words: galaxies: high-redshift
© The Authors 2025
 Open Access article, published by EDP Sciences, under the terms of the Creative Commons Attribution License (https://creativecommons.org/licenses/by/4.0), which permits unrestricted use, distribution, and reproduction in any medium, provided the original work is properly cited.
This article is published in open access under the Subscribe to Open model. This email address is being protected from spambots. You need JavaScript enabled to view it. to support open access publication.
1. Introduction
The approximately 15 galaxies that have been discovered so far by the James Webb Space Telescope (JWST) at redshift z > 10 (Naidu et al. 2022; Arrabal Haro et al. 2023a; Hsiao et al. 2024; Wang et al. 2023; Fujimoto et al. 2023a; Atek et al. 2023; Curtis-Lake et al. 2023; Bunker et al. 2023; Tacchella et al. 2023; Arrabal Haro et al. 2023b; Finkelstein et al. 2023; Castellano et al. 2024; Zavala et al. 2025; Helton et al. 2024; Carniani et al. 2024a; Robertson et al. 2024) have raised a number of questions concerning early galaxy evolution. Not only does their number significantly overshoot extrapolations and models anchored at lower redshifts, these objects also share some peculiar properties whose origin constitutes a challenging puzzle for ΛCDM-based1 galaxy formation scenarios.
At odds with their lower-redshift counterparts, many super-early galaxies are characterized by bright UV luminosities (MUV ≲ −20), and steep UV spectral slopes (β ≲ −2.2), compact sizes (effective radius re ≈ 200 pc). The analysis of their spectral energy distribution suggests high (for their epoch) stellar masses (M⋆ ≈ 109 M⊙), and thus identifies these rare systems as high-σ peaks of the cosmic density field that populate the bright end of the luminosity function. Several alternative hypotheses have been suggested to explain the above properties2.
According to the so-called attenuation-free model (AFM; Ferrara et al. 2023; Ziparo et al. 2023; Fiore et al. 2023; Ferrara 2024a,b), bright luminosities and blue colors result from extremely low dust attenuation conditions. These might be due to a low absorbing dust column density or to grain optical properties that produce gray relatively transparent extinction curves (see, e.g. Markov et al. 2024) at high redshift.
The AFM postulates that dust has been produced in supernova (SN) ejecta with a standard net3 yield yd ≈ 0.1 M⊙/SN. Although it was corroborated by theoretical and observational work (Nozawa et al. 2010), this yield remains uncertain and even more so in the early Universe. Therefore, we allowed the dust-to-stellar mass ratio to vary by > 3 orders of magnitude (see Sect. 2). After their injection into the interstellar medium, grains could either grow by gas-phase heavy element accretion and/or be partially destroyed by shocks. However, at z > 10 the prevailing physical conditions result in timescales of both processes that are longer than the Hubble time. This means that they are ineffective (Ferrara et al. 2016; Hirashita & Aoyama 2019; Martínez-González et al. 2019; Leśniewska & Michałowski 2019; Dayal et al. 2022; Priestley et al. 2021). The same argument applies to other known dust sources, such as AGB and evolved stars (Ferrarotti & Gail 2006; Valiante et al. 2009).
As corroborated by the evidence for significant amounts of heavy elements in many super-early galaxies (Curti et al. 2023; Bunker et al. 2023; Calabrò et al. 2024), it is physically sound to assume that dust was also copiously produced by the large number (≈107) of SNe in these galaxies. Moreover, due to the super-early galaxies very compact size, Ferrara (2024a) have shown that in a few million years, the produced dust would completely obscure them. Instead, JWST spectra indicate extremely low V-band attenuations, AV ≲ 0.3.
To unify several aspects of the problem, it has been proposed that in spite of the high stellar masses, attenuation-free conditions can be established by outflows (Ziparo et al. 2023; Fiore et al. 2023). As the luminosities of super-early objects most often exceed the effective Eddington luminosity for a dusty medium (Ferrara 2024a), which can to first order be translated into a lower bound on the specific star formation rate sSFR > 25 Gyr−1, they can launch powerful outflows that are driven by radiation pressure on the dust itself.
As AV ∝ rd−2, where rd is the radial extent of the dust distribution, the outflow can effectively reduce the attenuation by transporting dust on larger spatial scales. For example, an expansion of the distribution from re ≈ 200 pc to ≈2 kpc would cause a dramatic drop in the UV optical depth by 100 times, which would make the galaxy almost transparent and bright. Thus, the AFM predicts that dust is significantly more extended than the stars in super-early galaxies. Moreover, this dust component is thought to emit thermal far-infrared (FIR) continuum by reprocessing the grain of the absorbed UV/optical light from the stars within re.
We assess whether the FIR signal produced by this extended dust distribution that is produced by outflows can be detected by the Atacama Large Millimeter Array (ALMA). The detection depends on several factors, such as the (i) spatial extent, (ii) mass, and (iii) temperature (including CMB effects) of the dust, and the (iv) grain optical properties. This experiment represents a stringent test for the AFM.
We mainly concentrate on the specific but yet utmost important case of the most distant known galaxy, GS-z14-0 (z = 14.32; Carniani et al. 2024a), for which the required ALMA data will soon become available (DDT 2023.A.00037.S, PI: S. Schouws).
A positive detection would strongly support the idea that dust is produced by SNe and that it is subsequently ejected by outflows outside the galaxy main body. A nondetection would instead place meaningful upper limits on the early dust production and properties at these as yet basically unexplored cosmic epochs. We also applied the model to an additional four z > 10 galaxies.
2. FIR dust continuum emission
To predict the expected FIR continuum emission, we first quantified the dust production and its spatial distribution. Next, we computed the dust temperature including the CMB and radiative transfer effects. From these quantities, we finally obtained the observed FIR flux from a given galaxy.
2.1. Dust production
At high redshift (z > 7), the dust production can safely be assumed to be largely dominated by SNe (Todini & Ferrara 2001; Leśniewska & Michałowski 2019; Dayal et al. 2022; Sommovigo et al. 2022; Ferrara et al. 2022; Schneider & Maiolino 2024) because grain growth (Ferrara et al. 2016; Hirashita & Aoyama 2019) is subdominant, and the evolution times of other known sources (AGB and evolved stars; Valiante et al. 2009) exceed the Hubble time (294 Myr at z = 14.32).
We assumed that stars form according to a Salpeter initial mass function in the range 1 − 100 M⊙. As a result, an SN occurs every ν−1 = 52.9 M⊙ of stars formed.
The dust yield per SN is rather uncertain because it involves complex nucleation physics of heavy elements in the SN ejecta. Newly formed grains are also subject to destruction processes when they pass through the reverse shock. The net production yield is therefore poorly constrained, but local SN studies (Matsuura et al. 2015; Rho et al. 2018; Priestley et al. 2021; Niculescu-Duvaz et al. 2021) also support that it ranges from 0.01 to 1.1 M⊙. Therefore, we used yd = 0.1 M⊙ as a fiducial value.
Given the IMF, this corresponds to a dust-to-stellar ratio ξd = ydν = 1/529. However, given the above uncertainties, we explored the implications of the wide range of values −5 < log ξd < −1.6. This range should therefore encompass a situation in which freshly formed dust is heavily destroyed by the reverse shock and a super-efficient dust condensation under very favorable conditions.
For the fiducial value of ξd and the measured stellar mass of GS-z14-0 (M⋆ = 4 × 10⁸ M⊙; Carniani et al. 2024a), we find that 7.5 × 10⁵ M⊙ of dust should have been produced by the time of the observation. We recall that dust typically condenses in the ejecta a few hundred days after the explosion (Todini & Ferrara 2001; Nozawa et al. 2007). For our purposes, dust production can be considered as instantaneous and as occurring on the same evolutionary timescale as SN massive star progenitors, that is, ≲20 Myr.
2.2. Dust spatial distribution
Initially, the dust is distributed as the observed massive stars, providing the observed rest frame UV luminosity. In GS-z14-0, these are distributed within a measured effective radius re = 260 pc. Under this hypothesis, the dust optical depth at 1500 Å would be equal to τ1500e = (κ1500ξd/4πre2)M⋆ = 23.3, based on a value of the dust mass absorption coefficient κ1500 = 1.26 × 105 cm2 g−1 as appropriate for a MW-like extinction curve (Weingartner & Draine 2001, WD01).
By translating the observed  value into an optical depth using τ1500 = 2.655(AV/1.086), where the prefactor accounts for the differential attenuation between 1500 Å and the V band for a MW curve, we find τ1500 = 0.76. This value is ≈30 times lower than τ1500e. The value of AV was inferred from SED modeling (Carniani et al. 2024a), and it might therefore be somewhat degenerate with other fitting quantities. Based on the posterior probability distribution shown in Carniani et al. (2024a) and on the measured blue UV slope (β = −2.2), we take it that the degeneracy does not represent a serious problem for the model.
Using the AFM to predict the star formation history of GS-z14-0, Ferrara (2024b) found that this galaxy recently underwent a super-Eddington phase in which a powerful outflow mini-quenched its star formation and left it in the observed post-stardust phase. The outflow ejected a significant fraction of the dust, metals, and gas that were previously contained in re.
Based on the previous estimates, we see that to decrease AV to its observed value, the dust has to be reconfigured by the outflow into a much more extended distribution with a radius of rd = (τ1500e/τ1500)1/2re = 5.5re, which corresponds to rd ≃ 1.4 kpc for the fiducial ξd value.
Without the outflow hypothesis, an extremely low dust content needs to be assumed that corresponds to ξd = 6.6 × 10⁻⁵ to make the galaxy optically thin. For comparison, for galaxies in the REBELS sample (Bouwens et al. 2022), ξd ≈ 0.01 (Ferrara et al. 2022; Dayal et al. 2022; Sommovigo et al. 2022). The results presented below explore both (and additional) possibilities and show that ALMA observations can clearly distinguish between these two alternative scenarios by detecting the FIR dust emission.
2.3. Dust temperature
Dust grains are heated by absorption of UV photons, whose energy is reemitted in the FIR. Depending on the assumed spatial distribution, the grains can achieve different temperatures, and they thus affect the emitted FIR flux. The latter was computed here at a rest-frame wavelength of 88 μm since high-z ALMA observations are often tuned to detect [O III] 88 μm line emission (Popping 2023; Bakx et al. 2022; Kaasinen et al. 2023; Fujimoto et al. 2023b; Kohandel et al. 2023).
The emitted radiation spectrum was classically modeled (e.g. Dayal et al. 2010; Hirashita et al. 2014) as a graybody at a mean dust temperature,  , given by
 (1)
(1)
where
 (2)
(2)
and Labs = Lbol(1 − e−τ1500) is the fraction of the stellar UV radiation that is absorbed by dust. The galaxy bolometric luminosity is written as Lbol = fbolL1500, where the intrinsic galaxy luminosity at 1500 Å (L1500) was obtained from the inferred star formation rate (SFR) via a conversion factor, 𝒦1500 [L⊙/M⊙ yr−1], whose value was chosen so as to match the value used by the ALMA REBELS survey (Bouwens et al. 2022): 𝒦1500 ≡ L1500/SFR = 0.587 × 10¹⁰. Following Fiore et al. (2023), we adopted fbol = 2.
We took the mass absorption coefficient κ88 and βd consistently with the adopted WD01 extinction curve κ88 = 34.15 cm2 g−1, and βd = 2.03; ζ and Γ are the zeta and gamma functions, respectively. Finally, ν88 is the frequency corresponding to a wavelength λ = 88 μm. The other symbols have the usual meaning.
The temperature in Eq. (1) is a mean (or effective) physical dust temperature such that the energy balance between dust absorbed and emitted photon energy is guaranteed. In general, however, radiative transfer effects produce a temperature distribution in which Td decreases away from the source. It is therefore necessary to include a correction factor, which becomes important when the system becomes optically thick.
Ferrara et al. (2022, see their Appendix A) showed that the luminosity-weighted temperature, ⟨Td⟩L, of an absorbing dust slab depends on its total optical depth and can be written as
 (3)
(3)
where b = 4 + βd. Applying Eq. (3) results in temperatures that are generally higher4 than  . To conserve energy, Md must be reduced by a factor fL−(4 + βd). In the following, we denote this reduced dust mass by Md′=fL−(4 + βd)Md.
2.4. Observed flux at 88 μm
From the previous results, it is straightforward to compute the rest-frame 88 μm specific flux from a source at z = zs observed at wavelength 88(1 + zs) μm,
![Mathematical equation: $$ \begin{aligned} F_{88} = g(z_s)\, \kappa _{88} M^{\prime }_d \left[B_{88}\left(T^{\prime }_d\right)-B_{88}\left(T_{\rm CMB}\right)\right]. \end{aligned} $$](/articles/aa/full_html/2025/02/aa52368-24/aa52368-24-eq10.gif) (4)
(4)
Here, Bλ is the blackbody spectrum, and TCMB(z) = T0(1 + zs), with T0 = 2.7255 K (Fixsen 2009) is the CMB temperature at redshift zs. Equation (4) accounts for the fact that the CMB acts as a thermal bath for dust grains and sets a lower limit to their temperature. At zs = 14.32, this minimum temperature corresponds to TCMB = 41.75 K. Finally, T′d is the CMB-corrected dust temperature5 following Da Cunha et al. (2013),
![Mathematical equation: $$ \begin{aligned} T^{\prime }_d = \left\{ \langle T_d \rangle _L^{4+\beta _d}+T_0^{4+\beta _d}\left[(1+z)^{4+\beta _d}-1\right]\right\} ^{1/\left(4+\beta _d\right)}. \end{aligned} $$](/articles/aa/full_html/2025/02/aa52368-24/aa52368-24-eq11.gif) (5)
(5)
3. Results
Figure 1 summarizes our predictions for the ALMA dust continuum emission from GS-z14-0. The top (bottom) panel shows the dependence of the luminosity-weighted dust temperature (88 μm flux) for a spherical dust distribution with a varying radius rd, normalized to the observed effective stellar radius, re, of the galaxy. Each curve corresponds to a dust-to-stellar ratio, ξd, in the range −5 < log ξd < −1.6, equally spaced in 0.1 logarithmic intervals. The black curve highlights the fiducial case log ξd = −2.72, or ξd = 1/529.
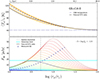 |
Fig. 1. Model predictions for GS-z14-0. Top panel: temperature distribution as a function of the dust spatial distribution radius, rd, in units of the effective stellar radius of GS-z14-0, re = 260 pc. The different orange curves span the range of the dust-to-stellar ratio −5 < log ξd < −1.6, equally spaced in 0.1 logarithmic intervals. The black curve highlights the fiducial case log ξd = −2.72(ξd = 1/529). We also show the CMB temperature at the galaxy redshift z = 14.32. The circles indicate the radius for which AV of the galaxy matches the observed radius, AV = 0.31. Bottom panel: as in the top panel, but for the predicted observed flux from GS-z14-0 at 88 μ. We also show the expected 3σ sensitivity limit (18 μJy/beam) and the spatial resolution (0.418″) of the DDT 2023.A.00037.S (PI: S. Schouws) observations. |
The luminosity-weighted temperature trend can be understood with the help of Eq. (3). Along each orange curve, the dust mass Md = ξd M⋆ is fixed. The most evident feature is the decrease in the dust temperature from 110–125 K at rd = re to the CMB temperature at the largest considered radii (17.5 kpc), where the dust becomes virtually undetectable. The temperature drop arises because at more extended and therefore more optically thin dust distributions, the absorbed stellar radiation decreases and the dust becomes colder. If the dust were not ejected from the galaxy, and therefore rd = re, the dust-to-stellar ratio would be very low (log ξd = −4.2) to yield the measured AV = 0.31 (denoted by circles).
In addition to this trend, the curves differ by up to 10–20% at any given radius as a result of variations in Md from one curve to the next, and because for small radii, most curves (specifically, those with log ξd > −4.2) correspond to optically thick regimes for which ⟨Td⟩L is slightly higher (see Eq. (3)). This is clearly shown by the optically thick limit τ1500 → ∞, in which ⟨Td⟩L ∝ τ15001/(4 + βd). For each curve, the circles mark the radius at which the attenuation matches the observed value AV = 0.31 (higher/lower AV values to the left/right). For each value of ξd, the temperature indicated by the circle is then the true (i.e., predicted) one within the model assumptions.
The behavior of F88 in the optically thick regime can be understood as follows. From Eq. (4), further neglecting CMB effects, which is appropriate because dust is hot at small radii, it follows that F88 ∝ M′Bν(⟨Td⟩L)≃M′⟨Td⟩L in the Rayleigh-Jeans regime. We showed above that ⟨Td⟩L ∝ τ15001/(4 + βd); also,  . Hence, F88 decreases as τ1500−(3 + βd)/(4 + βd), which is exactly the trend shown in Fig. 1.
The corresponding 88 μm flux is shown in the bottom panel, where it is also compared with the expected 3σ continuum sensitivity (18 μJy/beam) and the spatial resolution (0.451″) of the ALMA DDT 2023.A.00037.S (PI: S. Schouws) observations of GS-z14-0. For each ξd value, the flux rises, reaches a peak (approximately where τ1500 ≈ 1), and decreases at large radii. The amplitude of the peak correlates with ξd. As the distribution becomes optically thick for low rd/re values, the curves with larger ξd (or, equivalently, higher Md) converge to a single line.
The circles (AV = 0.31) show that the fiducial model (black line, ξd = 1/529) predicts a 88 μm flux  Jy, essentially at the 3σ detection limit of the experiment, and a luminosity-weighted temperature of 72 K. As ξd decreases, implying an efficient grain destruction by interstellar shocks, the signal becomes weaker and more difficult to detect. However, if the galaxy is dust rich, at or above the level observed in some of the REBELS galaxies showing ξd ≈ 0.01 (Ferrara et al. 2022; Dayal et al. 2022; Inami et al. 2022), the signal becomes detectable.
It is important to recall that the observed F88 measurement (or upper limit) should be interpreted along with the constraints provided by the observed AV value. For example, we assumed that consistently with the fiducial model in Fig. 2, F88 is measured to be 14.9 μJy (circle on the black curve). We then conclude that ξd = 1/529, and log(rdfid/re)≃0.7, or rd = 1.3 kpc. If this were correct, ALMA observations should also show that the dust is spatially resolved and more extended than the stellar component. The other more compact solution for the same F88, that is, log(rd/re)≃0.4, should be discarded because the galaxy would have an AV much higher than observed.
 |
Fig. 2. Same as Fig. 1, but assuming that the dust consists of large silicate grains with a log-normal distribution centered at 0.5 μm, as appropriate for grains that freshly formed in SN ejecta. |
The natural case to explore is the case in which the dust in the absence of any ejective event remains within re. In this scenario, the temperature would be significantly higher (≃100 K) and the distribution would be optically thick. These two properties act to dramatically suppress the flux: Regardless of ξd (unless it is extremely small), F88 = 5.3 μJy. Detecting such a low flux would require very long integration times.
In conclusion, a positive detection would strongly support the hypothesis that dust produced by SNe associated with the observed stars in GS-z14-0 has been carried to larger galactocentric radii by outflows. This causes the galaxy to become bright and transparent to UV radiation. This conclusion highlights the key importance of ALMA deep observations of super-early galaxies.
3.1. Large grains
In addition to dust ejection or destruction by shocks, we considered a third possibility, that is, that early dust consists of large grains with sizes of 0.1 − 1 μm. This is based on two facts: (a) It is theoretically predicted that SN dust lacks small grains, which are preferentially destroyed in the ejecta by the reverse shock (Nozawa et al. 2007; Asano et al. 2013; Hirashita & Aoyama 2019). (b) Experimentally, the SED of galaxies in z = 2 − 12 JWST-detected galaxies shows an increasingly flatter extinction curve toward high-z (Di Mascia et al. 2021; Markov et al. 2024). These two pieces of evidence are clearly connected because large grains of size a absorb light with a wavelength λ ≪ a in a frequency-independent way. In this case, the absorption cross section should be equal to the geometric one, and the UV absorption coefficient  , where δg = 2.95 g cm−3 is the material density of silicate grains, that is, those that are preferentially produced by SNe. If a = 0.5 μm,
  .
.
These estimates were confirmed by detailed calculations performed by Ysard et al. (2019), which we used here. These authors computed the optical properties of 0.01 μm to 10 cm grains from effective medium and Mie theories. To do this, they assumed a log-normal distribution of the grain sizes centered at a given radius, a0, which we assumed to be equal to 0.5 μm according to the previous discussion, and a fixed dispersion σ = 0.7. With these assumptions, they indeed found  and
and  .
.
Figure 2 presents the temperature and expected flux if dust is composed of large ≃0.5 μm grains. The temperature follows the same trend as in the standard case, but it is significantly colder. It reaches values in the range 75–85 K at re. As a result, for any given ξd, the flux is lower, for instance,  Jy, and it shifts to smaller radii compared to the standard case. The lower opacity of large grains also allows the galaxy to become optically thin (as observed) for more compact distributions.
3.2. Other super-early galaxies
Our model can be used to predict the FIR observability of other potentially detectable super-early galaxies. In addition to GS-z14-0, which has the largest AV of the z > 10 spectroscopically confirmed galaxies, we selected the next three dustiest galaxies, GS-z14-1 (AV = 0.20), UNCOVER-z12 (0.19), and GS-z11-0 (0.18). We also included GHZ2 in spite of its very low attenuation (AV = 0.04; Castellano et al. 2024, but see Zavala et al. 2025, who found AV = 0.01 − 0.2 depending on the SED fitter used) because of its spectrum is very interesting and shows many prominent emission lines.
The relevant properties (redshift, AV, SFR, M⋆, and re) of the galaxies in the sample are reported in Table 1, along with the predicted value of the fiducial 88 μm flux and the radius rdfid at which the attenuation becomes equal to the observed AV value. We also show the maximum expected flux,  , which we took from the curve with the maximum assumed value of log ξd = −1.6.
Relevant properties of the selected super-early galaxies at z > 10.
For the galaxies in the sample, the dust temperature and FIR flux follow very similar trends with rd/re, as shown in Fig. 1 for GS-z14-0, but they differ quantitatively as a result of the different properties of the galaxy. The table shows that the expected fiducial fluxes range from 2 μJy for the faintest galaxy (GS-z14-1) to 14.9 μJy for the brightest (and most distant) galaxy, GS-z14-0. The latter therefore remains the most promising target for constraining the dust content of the very early galaxies. When we instead assume the largest attenuation found by Zavala et al. (2025), AV = 0.2, we find a larger fiducial and maximum flux for GHZ2,  Jy and
  Jy, respectively.
Finally, we did not consider the remarkable galaxy GN-z11 (Bunker et al. 2023) because it is not visible by ALMA: It is located in the northern hemisphere location. However, this galaxy has been observed by the Northern Extended Millimeter Array (NOEMA; Fudamoto et al. 2024). These observations placed a 1σ upper limit of 13 μJy/beam at 160 μm. When this was applied to GN-z11, our model (fiducial case) predicted a maximum flux  Jy. Although interesting, available NOEMA observations are unfortunately too shallow for detecting the expected signal.
4. Summary
To test one of the predictions of the AFM (Ferrara et al. 2023; Ferrara 2024a), we modeled the FIR dust continuum emission from the extended dust distribution produced by outflows around so-called blue monsters, that is, luminous blue super-early (z > 10) galaxies. Based on the observed properties of the galaxies (redshift, AV, SFR, M⋆, and re), the expected flux at 88 μm depends on the dust-to-stellar ratio, ξd, and on the extent of the dust distribution, rd. A signal detection with ALMA would therefore constrain the amount of dust and its extent, thus representing a successful test that the attenuation-free conditions are produced by dust ejection by (likely, radiation-driven) outflows. We discussed in detail GS-z14-0 (z = 14.32), and we further applied the model to another four super-early galaxies. Our results are listed below.
-
When the dust is in the galaxy (rd = re), its temperature is 110–125 K. In this case, the dust-to stellar mass ratio must be very low (log ξd < −4.2), however, so that it does not exceed the measured AV = 0.31. For rd > re, ⟨Td⟩L decreases asymptotically toward TCMB (Fig. 1, top panel).
-
The fiducial model (ξd = 1/529) predicts an observed flux
 Jy for GS-z14-0 and a dust extent rd ∼ 1.4 kpc (Fig. 1, bottom panel). For the highest value we considered, log ξd = −1.6,
  Jy. These values are lower (
 Jy) when the dust predominantly consists of large grains, such as those that form in SN ejecta (Fig. 2).
 -
Forthcoming ALMA observations, with an expected 3σ sensitivity of 18 μJy, should come very close to constraining the fiducial predictions of the outflow-based attenuation-free model.
-
Other super-early galaxies are predicted (Table 1) to be fainter at 88 μm, mostly because their SFR is lower than that of GS-z14-0, but also because their AV is lower, with fiducial fluxes in the range
 Jy.
Jy.
We conclude by cautioning that although our model was built to catch the main features of the AFM, its simple incarnation cannot include potentially non-negligible effects that might change our conclusions quantitatively. For example, our study does not account for self-heating of the dust by reprocessed thermal photons, dust scattering, and grain size distribution. The impact of these effects on the results presented here can only be ascertained via dedicated numerical radiative transfer simulations.
After submission of this manuscript, two different groups (Schouws et al. 2024; Carniani et al. 2024b) have presented the analysis of the ALMA DDT observations of GS-z14-0. Both groups reported no dust continuum detection at 88 μm (upper limits F88μm < 15.1 μJy). This suggests an upper limit on the dust-to-stellar mass ratio of < 2 × 10⁻³ according to the AFM, which is consistent with dust production from supernovae with a yield yd < 0.3 M⊙. We refer to these papers for a more extended discussion.
Throughout the paper, we assume a flat Universe with the following cosmological parameters: ΩM = 0.3075, ΩΛ = 1 − ΩM, and Ωb = 0.0486, h = 0.6774, σ8 = 0.826, where ΩM, ΩΛ, and Ωb are the total matter, vacuum, and baryon densities in units of the critical density; h is the Hubble constant in units of 100 km s−1, and σ8 is the late-time fluctuation amplitude parameter (Planck Collaboration XVI 2014).
These include (a) star formation variability (Mason et al. 2023; Mirocha & Furlanetto 2023; Pallottini & Ferrara 2023), (b) reduced feedback resulting in a higher star formation efficiency (Dekel et al. 2023; Li et al. 2024), and (c) a top-heavy initial mass function (IMF) (Inayoshi et al. 2022); although see Cueto et al. (2024). More exotic solutions involving primordial black holes have also been suggested (Liu & Bromm 2022).
That is, after reprocessing by the reverse shock that thermalized the ejecta.
We neglected self-heating by the dust, that is, absorption of thermal IR radiation emitted by the grains, as it becomes important at high optical depth (Gordon et al. 2017), while the configurations of interest here have AV < 1.
In the remainder of the paper, we refer to the dust temperature as the CMB-corrected one, that is, T′d in Eq. (5).
Acknowledgments
We thank J. Zavala and M. Castellano for useful discussions, data and comments. This work is supported by the ERC Advanced Grant INTERSTELLAR H2020/740120, and in part by grant NSF PHY-2309135 to the Kavli Institute for Theoretical Physics (KITP). Plots in this paper produced with the MATPLOTLIB (Hunter 2007) package for PYTHON.
References
- Arrabal Haro, P., Dickinson, M., Finkelstein, S. L., et al. 2023a, Nature, 622, 707 [NASA ADS] [CrossRef] [Google Scholar]
- Arrabal Haro, P., Dickinson, M., Finkelstein, S. L., et al. 2023b, ApJ, 951, L22 [NASA ADS] [CrossRef] [Google Scholar]
- Asano, R. S., Takeuchi, T. T., Hirashita, H., & Inoue, A. K. 2013, Earth Planets Space, 65, 213 [NASA ADS] [CrossRef] [Google Scholar]
- Atek, H., Shuntov, M., Furtak, L. J., et al. 2023, MNRAS, 519, 1201 [Google Scholar]
- Bakx, T. J. L. C., Zavala, J. A., Mitsuhashi, I., et al. 2022, MNRAS, 519, 5076 [Google Scholar]
- Bouwens, R. J., Smit, R., Schouws, S., et al. 2022, ApJ, 931, 160 [NASA ADS] [CrossRef] [Google Scholar]
- Bunker, A. J., Saxena, A., Cameron, A. J., et al. 2023, A&A, 677, A88 [NASA ADS] [CrossRef] [EDP Sciences] [Google Scholar]
- Calabrò, A., Castellano, M., Zavala, J. A., et al. 2024, ApJ, 975, 245 [CrossRef] [Google Scholar]
- Carniani, S., Hainline, K., D’Eugenio, F., et al. 2024a, Nature, 633, 318 [CrossRef] [Google Scholar]
- Carniani, S., D’Eugenio, F., Ji, X., et al. 2024b, A&A, submitted [arXiv:2409.20533] [Google Scholar]
- Castellano, M., Napolitano, L., Fontana, A., et al. 2024, ApJ, 972, 143 [Google Scholar]
- Cueto, E. R., Hutter, A., Dayal, P., et al. 2024, A&A, 686, A138 [NASA ADS] [CrossRef] [EDP Sciences] [Google Scholar]
- Curti, M., D’Eugenio, F., Carniani, S., et al. 2023, MNRAS, 518, 425 [Google Scholar]
- Curtis-Lake, E., Carniani, S., Cameron, A., et al. 2023, Nat. Astron., 78, 622 [CrossRef] [Google Scholar]
- Da Cunha, E., Groves, B., Walter, F., et al. 2013, ApJ, 766, 13 [NASA ADS] [CrossRef] [Google Scholar]
- Dayal, P., Hirashita, H., & Ferrara, A. 2010, MNRAS, 403, 620 [NASA ADS] [CrossRef] [Google Scholar]
- Dayal, P., Ferrara, A., Sommovigo, L., et al. 2022, MNRAS, 512, 989 [NASA ADS] [CrossRef] [Google Scholar]
- Dekel, A., Sarkar, K. C., Birnboim, Y., Mandelker, N., & Li, Z. 2023, MNRAS, 523, 3201 [NASA ADS] [CrossRef] [Google Scholar]
- Di Mascia, F., Gallerani, S., Behrens, C., et al. 2021, MNRAS, 503, 2349 [NASA ADS] [CrossRef] [Google Scholar]
- Ferrara, A. 2024a, A&A, 684, A207 [NASA ADS] [CrossRef] [EDP Sciences] [Google Scholar]
- Ferrara, A. 2024b, A&A, 689, A310 [NASA ADS] [CrossRef] [EDP Sciences] [Google Scholar]
- Ferrara, A., Viti, S., & Ceccarelli, C. 2016, MNRAS, 463, L112 [NASA ADS] [CrossRef] [Google Scholar]
- Ferrara, A., Sommovigo, L., Dayal, P., et al. 2022, MNRAS, 512, 58 [NASA ADS] [CrossRef] [Google Scholar]
- Ferrara, A., Pallottini, A., & Dayal, P. 2023, MNRAS, 522, 3986 [NASA ADS] [CrossRef] [Google Scholar]
- Ferrarotti, A. S., & Gail, H. P. 2006, A&A, 447, 553 [CrossRef] [EDP Sciences] [Google Scholar]
- Finkelstein, S. L., Leung, G. C. K., Bagley, M. B., et al. 2023, ArXiv e-prints [arXiv:2311.04279] [Google Scholar]
- Fiore, F., Ferrara, A., Bischetti, M., Feruglio, C., & Travascio, A. 2023, ApJ, 943, L27 [NASA ADS] [CrossRef] [Google Scholar]
- Fixsen, D. J. 2009, ApJ, 707, 916 [Google Scholar]
- Fudamoto, Y., Oesch, P. A., Walter, F., et al. 2024, MNRAS, 530, 340 [NASA ADS] [CrossRef] [Google Scholar]
- Fujimoto, S., Wang, B., Weaver, J., et al. 2023a, ArXiv e-prints [arXiv:2308.11609] [Google Scholar]
- Fujimoto, S., Finkelstein, S. L., Burgarella, D., et al. 2023b, ApJ, 955, 130 [NASA ADS] [CrossRef] [Google Scholar]
- Gordon, K. D., Baes, M., Bianchi, S., et al. 2017, A&A, 603, A114 [NASA ADS] [CrossRef] [EDP Sciences] [Google Scholar]
- Helton, J. M., Rieke, G. H., Alberts, S., et al. 2024, ArXiv e-prints [arXiv:2405.18462] [Google Scholar]
- Hirashita, H., & Aoyama, S. 2019, MNRAS, 482, 2555 [NASA ADS] [CrossRef] [Google Scholar]
- Hirashita, H., Ferrara, A., Dayal, P., & Ouchi, M. 2014, MNRAS, 443, 1704 [NASA ADS] [CrossRef] [Google Scholar]
- Hsiao, T. Y.-Y., Coe, D., Larson, R. L., et al. 2024, ApJ, 973, 8 [NASA ADS] [CrossRef] [Google Scholar]
- Hunter, J. D. 2007, Comput. Sci. Eng., 9, 90 [NASA ADS] [CrossRef] [Google Scholar]
- Inami, H., Algera, H. S. B., Schouws, S., et al. 2022, MNRAS, 515, 3126 [NASA ADS] [CrossRef] [Google Scholar]
- Inayoshi, K., Harikane, Y., Inoue, A. K., Li, W., & Ho, L. C. 2022, ApJ, 938, L10 [NASA ADS] [CrossRef] [Google Scholar]
- Kaasinen, M., van Marrewijk, J., Popping, G., et al. 2023, A&A, 671, A29 [NASA ADS] [CrossRef] [EDP Sciences] [Google Scholar]
- Kohandel, M., Ferrara, A., Pallottini, A., et al. 2023, MNRAS, 520, L16 [Google Scholar]
- Leśniewska, A., & Michałowski, M. J. 2019, A&A, 624, L13 [Google Scholar]
- Li, Z., Dekel, A., Sarkar, K. C., et al. 2024, A&A, 690, A108 [NASA ADS] [CrossRef] [EDP Sciences] [Google Scholar]
- Liu, B., & Bromm, V. 2022, ApJ, 937, L30 [NASA ADS] [CrossRef] [Google Scholar]
- Markov, V., Gallerani, S., Ferrara, A., et al. 2024, ArXiv e-prints [arXiv:2402.05996] [Google Scholar]
- Martínez-González, S., Wünsch, R., Silich, S., et al. 2019, ApJ, 887, 198 [CrossRef] [Google Scholar]
- Mason, C. A., Trenti, M., & Treu, T. 2023, MNRAS, 521, 497 [NASA ADS] [CrossRef] [Google Scholar]
- Matsuura, M., Dwek, E., Barlow, M. J., et al. 2015, ApJ, 800, 50 [NASA ADS] [CrossRef] [Google Scholar]
- Mirocha, J., & Furlanetto, S. R. 2023, MNRAS, 519, 843 [Google Scholar]
- Naidu, R. P., Oesch, P. A., van Dokkum, P., et al. 2022, ApJ, 940, L14 [NASA ADS] [CrossRef] [Google Scholar]
- Niculescu-Duvaz, M., Barlow, M. J., Bevan, A., Milisavljevic, D., & De Looze, I. 2021, MNRAS, 504, 2133 [NASA ADS] [CrossRef] [Google Scholar]
- Nozawa, T., Kozasa, T., Habe, A., et al. 2007, ApJ, 666, 955 [NASA ADS] [CrossRef] [Google Scholar]
- Nozawa, T., Kozasa, T., Tominaga, N., et al. 2010, ApJ, 713, 356 [NASA ADS] [CrossRef] [Google Scholar]
- Pallottini, A., & Ferrara, A. 2023, A&A, 677, L4 [NASA ADS] [CrossRef] [EDP Sciences] [Google Scholar]
- Planck Collaboration XVI. 2014, A&A, 571, A16 [NASA ADS] [CrossRef] [EDP Sciences] [Google Scholar]
- Popping, G. 2023, A&A, 669, L8 [NASA ADS] [CrossRef] [EDP Sciences] [Google Scholar]
- Priestley, F. D., De Looze, I., & Barlow, M. J. 2021, MNRAS, 502, 2438 [NASA ADS] [CrossRef] [Google Scholar]
- Rho, J., Gomez, H. L., Boogert, A., et al. 2018, MNRAS, 479, 5101 [NASA ADS] [CrossRef] [Google Scholar]
- Robertson, B., Johnson, B. D., Tacchella, S., et al. 2024, ApJ, 970, 31 [NASA ADS] [CrossRef] [Google Scholar]
- Schneider, R., & Maiolino, R. 2024, A&ARv, 32, 2 [NASA ADS] [CrossRef] [Google Scholar]
- Schouws, S., Bouwens, R. J., Ormerod, K., et al. 2024, ArXiv e-prints [arXiv:2409.20549] [Google Scholar]
- Sommovigo, L., Ferrara, A., Pallottini, A., et al. 2022, MNRAS, 513, 3122 [NASA ADS] [CrossRef] [Google Scholar]
- Tacchella, S., Eisenstein, D. J., Hainline, K., et al. 2023, ApJ, 952, 74 [NASA ADS] [CrossRef] [Google Scholar]
- Todini, P., & Ferrara, A. 2001, MNRAS, 325, 726 [NASA ADS] [CrossRef] [Google Scholar]
- Valiante, R., Schneider, R., Bianchi, S., & Andersen, A. C. 2009, MNRAS, 397, 1661 [CrossRef] [Google Scholar]
- Wang, B., Fujimoto, S., Labbé, I., et al. 2023, ApJ, 957, L34 [NASA ADS] [CrossRef] [Google Scholar]
- Weingartner, J. C., & Draine, B. T. 2001, ApJ, 548, 296 [Google Scholar]
- Ysard, N., Koehler, M., Jimenez-Serra, I., Jones, A. P., & Verstraete, L. 2019, A&A, 631, A88 [NASA ADS] [CrossRef] [EDP Sciences] [Google Scholar]
- Zavala, J. A., Castellano, M., Akins, H. B., et al. 2025, Nat. Astron., 9, 155 [Google Scholar]
- Ziparo, F., Ferrara, A., Sommovigo, L., & Kohandel, M. 2023, MNRAS, 520, 2445 [NASA ADS] [CrossRef] [Google Scholar]
All Tables
All Figures
|
Fig. 1. Model predictions for GS-z14-0. Top panel: temperature distribution as a function of the dust spatial distribution radius, rd, in units of the effective stellar radius of GS-z14-0, re = 260 pc. The different orange curves span the range of the dust-to-stellar ratio −5 < log ξd < −1.6, equally spaced in 0.1 logarithmic intervals. The black curve highlights the fiducial case log ξd = −2.72(ξd = 1/529). We also show the CMB temperature at the galaxy redshift z = 14.32. The circles indicate the radius for which AV of the galaxy matches the observed radius, AV = 0.31. Bottom panel: as in the top panel, but for the predicted observed flux from GS-z14-0 at 88 μ. We also show the expected 3σ sensitivity limit (18 μJy/beam) and the spatial resolution (0.418″) of the DDT 2023.A.00037.S (PI: S. Schouws) observations. |
| In the text | |
|
Fig. 2. Same as Fig. 1, but assuming that the dust consists of large silicate grains with a log-normal distribution centered at 0.5 μm, as appropriate for grains that freshly formed in SN ejecta. |
| In the text | |
Current usage metrics show cumulative count of Article Views (full-text article views including HTML views, PDF and ePub downloads, according to the available data) and Abstracts Views on Vision4Press platform.
Data correspond to usage on the plateform after 2015. The current usage metrics is available 48-96 hours after online publication and is updated daily on week days.
Initial download of the metrics may take a while.