| Issue |
A&A
Volume 689, September 2024
|
|
|---|---|---|
| Article Number | A310 | |
| Number of page(s) | 9 | |
| Section | Cosmology (including clusters of galaxies) | |
| DOI | https://doi.org/10.1051/0004-6361/202450944 | |
| Published online | 20 September 2024 | |
The eventful life of GS-z14-0, the most distant galaxy at redshift z = 14.32
Scuola Normale Superiore,
Piazza dei Cavalieri 7,
56126
Pisa,
Italy
Received:
31
May
2024
Accepted:
23
July
2024
Abstract
We developed a model for the star formation history (SFH) of super-early galaxies and applied it to GS-z14-0, the most distant galaxy known, located at z = 14.32 (294 million years after the Big Bang). The SFH, starting at z = 26.7, is complex. Initially (z > 18), the galaxy experiences feedback-regulated phases that are bursty, relatively faint (reaching MUV = −18.4), and unattenuated. When dust shielding allows for a smooth star formation rate (SFR), the galaxy quickly becomes heavily obscured. During this obscured phase, which lasts for approximately 20% of the total star-forming time, 70% of the observed stars are formed. Super-early galaxies in this phase should be detectable by ALMA. Twenty-six million years before observation, as the galaxy becomes super-Eddington, a powerful radiation-driven outflow clears most of the dust and significantly reduces the SFR by a factor of seven, from 100 → 15 M⊙ yr−1. The galaxy transitions into a “blue monster” dominating the bright end of the UV luminosity function. When the outflow ceases due to decreased dust opacity, the galaxy relaxes into a post-starburst phase, in which it is currently observed. Our model accurately reproduces all the observed and inferred properties of the galaxy. The analysis of this extreme system opens exciting opportunities for studying the beginnings of the luminous Universe.
Key words: galaxies: fundamental parameters / galaxies: high-redshift / galaxies: individual: GS-z14-0 / galaxies: star formation
Corresponding author; e-mail: This email address is being protected from spambots. You need JavaScript enabled to view it.
© The Authors 2024
 Open Access article, published by EDP Sciences, under the terms of the Creative Commons Attribution License (https://creativecommons.org/licenses/by/4.0), which permits unrestricted use, distribution, and reproduction in any medium, provided the original work is properly cited.
This article is published in open access under the Subscribe to Open model. This email address is being protected from spambots. You need JavaScript enabled to view it. to support open access publication.
1 Introduction
The James Webb Space Telescope (JWST), by breaking the red-shift z = 10 barrier, is finally pushing the frontier of the known universe deep into the Cosmic Dawn, the epoch when the first stars and galaxies formed. One of the major puzzles raised by these data (Bouwens et al. 2022a; Harikane et al. 2023a,b; McLeod et al. 2023; Finkelstein et al. 2023; Adams et al. 2023; Willott et al. 2024; Pérez-González et al. 2023; Robertson et al. 2023) concerns the overabundance of very bright, blue (and sometimes massive for their epoch) galaxies boosting the bright end of the UV luminosity function (LF).
The overabundance of such “blue monsters” has been explained, among other suggestions1, as a result of negligible dust attenuation in super-early galaxies (Ferrara et al. 2023; Fiore et al. 2023; Ziparo et al. 2023; Ferrara 2024). Clear signs of a decreasing UV slope with redshift, β, have been reported (e.g., Cullen et al. 2023; Austin et al. 2024; Stiavelli et al. 2023). Indeed, this simple hypothesis produces extremely good fits to the observed UV LFs at z > 10 (Ferrara 2024; Donnan et al. 2024).
However, this interpretation is at odds with the expectation that significant amount of dust, and hence attenuation, should be present given the large stellar masses (108–9 M⊙) and compact sizes (≈100 pc, Ono et al. 2022; Sun et al. 2023, Baldwin et al. 2024; Morishita et al. 2024; Langeroodi & Hjorth 2024) often observed in these systems. As a potential solution, it has been proposed (Ferrara 2024) that the intense stellar luminosity, coupled with the dust opacity, might render the galaxy super-Eddington, and able to drive powerful outflows that disperse the dust in the circumgalactic medium, making the galaxy visible and UV-bright.
To consolidate this scenario, it is necessary to study its implications. In particular, it should be able to explain not only the dust production and ejection, but also the star formation history (SFH) and observed properties of blue monsters.
Here, we examine the outstanding case of the newly discovered, spectroscopically confirmed galaxy GS-z14-0 at z = 14.32 (Carniani et al. 2024) found by the JWST JADES survey (Eisenstein et al. 2023). The galaxy has also been detected in the wide 7.7 μm MIRI filter (Helton et al. 2024). With its bright luminosity, MUV = −20.81, blue colors, β = −2.2, and small dust attenuation, AV = 0.31, GS-z14-0 located only 294 Myr after the Big Bang, represents a fascinating yet very challenging test case for the scenario described above.
We will see that super-early galaxies show complex SFH, and undergo bursty, obscured and “mini-quenching” star formation phases regulated by feedback processes, finally leading, at least in the case of GS-z14-0, to a blue monster. Thus, the analysis of this extreme galaxy, opens new and exciting perspectives for studying the beginnings of the luminous Universe2.
2 Basic equations
To derive the feedback-regulated SFH of super-early galaxies we start by writing the equations3 (see, e.g. Ferrara & Tolstoy 2000) determining the evolution of dark matter halo mass, M, gas mass, Mg, stellar mass, M*, and metal mass, MZ with cosmic time, t, in the galaxy:
![Mathematical equation: $\[\dot{M}(t)=\dot{M}_a(M, t)\]$](/articles/aa/full_html/2024/09/aa50944-24/aa50944-24-eq1.png) (1)
(1)
![Mathematical equation: $\[\dot{M}_g(t)=f_b \dot{M}_a-\left[(1-R)+\eta\left(t-t_D\right)\right] \dot{M}_{\star}(t)\]$](/articles/aa/full_html/2024/09/aa50944-24/aa50944-24-eq2.png) (2)
(2)
![Mathematical equation: $\[\dot{M}_{\star}(t)=\epsilon_{\star} \frac{M_g(t)}{t_{\mathrm{ff}}} f_{\mathrm{LW}}\left(t-t_D\right)(1-R)\]$](/articles/aa/full_html/2024/09/aa50944-24/aa50944-24-eq3.png) (3)
(3)
![Mathematical equation: $\[\dot{M}_Z(t)=\left[\left(\xi_Z-Z\right)(1-R)-\eta\left(t-t_D\right) Z\right] \dot{M}_{\star}(t).\]$](/articles/aa/full_html/2024/09/aa50944-24/aa50944-24-eq4.png) (4)
(4)
The halo growth is fed by cosmological accretion, whose rate (in M⊙ yr−1) is obtained from numerical simulations, for example Correa et al. (2015):
![Mathematical equation: $\[\dot{M}_a(M, z)=102.2 h[-\alpha-\beta(1+z)] E(z) M_{12}\]$](/articles/aa/full_html/2024/09/aa50944-24/aa50944-24-eq5.png) (5)
(5)
where (α, β) are parameters that depend on M(z), cosmology and the linear matter power spectrum, and provided4 in Appendix C of Correa et al. (2015); finally, E(z) = [Ωm(1 + z)3 + ΩΛ)]1/2, and M12 = M/1012 M⊙. We assume that no stars form before redshift z = z8 at which the halo crosses the atomic-cooling limit mass, M(z8) ≈ 108 M⊙ (Salvadori & Ferrara 2009; Ferrara et al. 2014). The results are however insensitive to the precise choice of this value.
2.1 Gas evolution
Gas is (i) accreted at the same rate as in Eq. (5) but scaled by the cosmological baryon fraction5 fb = Ωb/Ωm = 0.158, (ii) consumed by star formation, and (iii) lost via galactic outflows. These processes are described by the three r.h.s. terms in Eq. (2), respectively. The outflow rate is equal to ![Mathematical equation: $\[\eta \dot{M}_{\star}\]$](/articles/aa/full_html/2024/09/aa50944-24/aa50944-24-eq6.png) , where the loading factor η includes a delay time, tD. In principle tD could be different for the different types of feedback (Pallottini & Ferrara 2023), or depend on galaxy properties such as size or stellar mass. For simplicity, we adopt a fixed value of tD which is left as a free parameter of the model. The derivation of η for radiation-driven outflows is given in Sec. 3.2. We adopt a 1–100 M⊙ Salpeter IMF, for which the return fraction from stars, assuming IRA, is R = 0.69.
, where the loading factor η includes a delay time, tD. In principle tD could be different for the different types of feedback (Pallottini & Ferrara 2023), or depend on galaxy properties such as size or stellar mass. For simplicity, we adopt a fixed value of tD which is left as a free parameter of the model. The derivation of η for radiation-driven outflows is given in Sec. 3.2. We adopt a 1–100 M⊙ Salpeter IMF, for which the return fraction from stars, assuming IRA, is R = 0.69.
2.2 Star formation
Eq. (3) describes the conversion of gas mass into stars. The process occurs with an instantaneous efficiency, ϵ*, per free-fall time, tff = ζH(z)−1, where ζ = 0.06 and H(z)−1 is the Hubble time. We implicitly assume that the efficiency is regulated by the mechanical energy input by SNe for which we adopt the functional form in Ferrara et al. (2023):
![Mathematical equation: $\[\epsilon_{\star}=\epsilon_0 \frac{v_c^2}{v_c^2+f_w v_s^2}\]$](/articles/aa/full_html/2024/09/aa50944-24/aa50944-24-eq7.png) (6)
(6)
where υc is the halo circular velocity, fw = 0.12 is the SN energy coupling efficiency with the gas, and ![Mathematical equation: $\[v_s=\sqrt{v E_0}=975 \mathrm{~km} \mathrm{~s}^{-1}\]$](/articles/aa/full_html/2024/09/aa50944-24/aa50944-24-eq8.png) is a characteristic velocity associated with the SN energy released per unit stellar mass formed; E0 = 1051 erg, ν−1 = 52.89 M⊙, for the adopted IMF. We fix ϵ0 = 0.07, a value constrained by the fit to the luminosity functions at z ≳ 10 (Ferrara et al. 2023; Ferrara 2024). Star formation is also limited (via a suppression factor 0 < fLW < 1) by the availability of molecular hydrogen which is destroyed by photons in the Lyman–Werner (LW) energy range (11.2–13.6 eV) with a delay time tD. Such radiative feedback will be described in Sec. 3.1.
is a characteristic velocity associated with the SN energy released per unit stellar mass formed; E0 = 1051 erg, ν−1 = 52.89 M⊙, for the adopted IMF. We fix ϵ0 = 0.07, a value constrained by the fit to the luminosity functions at z ≳ 10 (Ferrara et al. 2023; Ferrara 2024). Star formation is also limited (via a suppression factor 0 < fLW < 1) by the availability of molecular hydrogen which is destroyed by photons in the Lyman–Werner (LW) energy range (11.2–13.6 eV) with a delay time tD. Such radiative feedback will be described in Sec. 3.1.
2.3 Metal enrichment
Eq. (4) describes the evolution of the metal mass MZ. Heavy elements are produced by stars, partly recycled into stars and ejected by outflows. The IMF-integrated yield of heavy elements produced by stars is ξZ = yZν, where yZ is the SN yield. We compute yZ from the results in Woosley & Heger (2007), and find yZ = 2.41 M⊙, with very weak dependence on stellar metallicity.
2.4 Dust
From the metal and gas mass we derive the gas metallicity, Z = MZ/Mg that we use to compute the (normalized) dust-to-gas ratio, ![Mathematical equation: $\[\mathcal{D}=\left(M_d / M_g\right) \mathcal{D}_{\mathrm{MW}}^{-1}\]$](/articles/aa/full_html/2024/09/aa50944-24/aa50944-24-eq9.png) , where Md is the dust mass, and
, where Md is the dust mass, and ![Mathematical equation: $\[\mathcal{D}\]$](/articles/aa/full_html/2024/09/aa50944-24/aa50944-24-eq10.png) MW = 1/162 is the Milky Way value. To this aim, we follow Rémy-Ruyer et al. (2014) who inferred
MW = 1/162 is the Milky Way value. To this aim, we follow Rémy-Ruyer et al. (2014) who inferred ![Mathematical equation: $\[\mathcal{D}\]$](/articles/aa/full_html/2024/09/aa50944-24/aa50944-24-eq11.png) for a large sample of local galaxies over a wide metallicity range. They find
for a large sample of local galaxies over a wide metallicity range. They find ![Mathematical equation: $\[\mathcal{D}\]$](/articles/aa/full_html/2024/09/aa50944-24/aa50944-24-eq12.png) = (Z/Z⊙)α, with α = 1.62 ± 0.34;
= (Z/Z⊙)α, with α = 1.62 ± 0.34;
From the dust mass we derive the galaxy dust optical depth. Following Ferrara (2024), we write
![Mathematical equation: $\[\tau_{1500}=\frac{\kappa_{1500}}{4 \pi r_e^2} M_d,\]$](/articles/aa/full_html/2024/09/aa50944-24/aa50944-24-eq13.png) (7)
(7)
where the dust mass absorption coefficient at 1500 Å is κ1500 = 1.26 × 105 cm2g−1 for a Milky Way extinction curve. To determine the stellar effective radius, re, we follow Shibuya et al. (2015, see also Morishita et al. 2024), and take re(z) = 0.01 rvir(z). For reference, a 1012 M⊙ halo at z = 14.32 has re = 210 pc.
3 Feedback processes
The evolution of the galaxy properties (gas, stellar, metal, dust mass) described by Eqs. (2)–(4) is strongly regulated by feedback processes. We explicitly consider two feedback types, namely (i) Lyman-Werner radiative feedback, and (ii) radiation-driven outflows.
SN feedback implicitly regulates star formation by controlling the efficiency (Eq. (6)). However, the SN contribution to outflow driving is subdominant, and not included in the model. The main reason is that at the high gas densities characterising super-early galaxies (Isobe et al. 2023), SN kinetic energy is very rapidly radiated away by catastrophic cooling of the post-shock gas (Pizzati et al. 2020), as discussed in Ferrara (2024).
It is also interesting to note that even in a metal-free gas with no dust, Lyα line radiation pressure can be substantial, as discussed by a number of papers (see, for example Smith et al. 2017; Kimm et al. 2018; Tomaselli & Ferrara 2021).
Feedback cannot be instantaneous, for a variety of physical reasons related to stellar evolution, radiation field fluctuations, evolution of photo-dissociated and ionized regions, gas dynamics and accretion. Each of these processes acts on a specific timescale (Pallottini & Ferrara 2023). Hence, it is important to include the feedback delay in the model, at least in a simplified manner. As we will see, delayed feedbacks introduce a physically rich SFH behavior.
3.1 Lyman–Werner feedback
Star formation is almost always associated with cold, molecular gas. However, the presence of molecules is not a necessary requirement (Glover & Clark 2012). Rather, the key requirement is that the gas can self-shield from UV radiation, a condition favored by the presence of dust and molecules. Thus, molecule formation and the formation of cold gas are both correlated with the column density of the cloud, and thus its shielding ability.
UV radiation in the LW band is absorbed by H2 molecules (and dust). A fraction ![Mathematical equation: $\[f_{\text {diss }}^* \approx 0.15\]$](/articles/aa/full_html/2024/09/aa50944-24/aa50944-24-eq14.png) of the absorptions (Krumholz et al. 2008) leads to photo-dissociation of the molecule, via the 2-step Solomon effect (Sternberg et al. 2014).
of the absorptions (Krumholz et al. 2008) leads to photo-dissociation of the molecule, via the 2-step Solomon effect (Sternberg et al. 2014).
To quantify the effects of LW feedback we introduce the shielding radius, rsh, i.e. the radial distance at which the LW flux produced by the stars located at the center of the halo can penetrate, and hence inhibit star formation. We use the results in Ferrara et al. (2019) to write
![Mathematical equation: $\[r_{\mathrm{sh}}=\frac{N_d}{n} \ln (1+w \chi)\]$](/articles/aa/full_html/2024/09/aa50944-24/aa50944-24-eq15.png) (8)
(8)
In Eq. (8) Nd is the dust column density at which the dust optical depth to UV photons (at 1000 Å) becomes equal to unity,
![Mathematical equation: $\[N_d=1 / \sigma_d=5 \times 10^{20} \mathcal{D}^{-1} \mathrm{~cm}^{-2}.\]$](/articles/aa/full_html/2024/09/aa50944-24/aa50944-24-eq16.png) (9)
(9)
Assuming that a fraction fd = 0.1 of the total gas mass is located within re, the mean gas density is ![Mathematical equation: $\[n=3 f_d M_g / 4 \pi m_p r_e^3\]$](/articles/aa/full_html/2024/09/aa50944-24/aa50944-24-eq17.png) . Finally,
. Finally,
![Mathematical equation: $\[w=\frac{1}{1+0.9 \mathcal{D}^{1 / 2}}, \quad \chi=\frac{f_{\mathrm{diss}}^* \sigma_d}{\mathcal{R}} \frac{F_{\mathrm{LW}}}{n}.\]$](/articles/aa/full_html/2024/09/aa50944-24/aa50944-24-eq18.png) (10)
(10)
The first quantity is a correction factor accounting for the probability that a LW photon is absorbed by dust grains (associated with H2) rather than by H2 molecules.
The parameter χ is instead proportional to the LW photodissociation parameter FLW/n, where FLW is the LW photon flux (cm−2 s−1). The coefficient contains the total H2 formation rate in the gas phase catalyzed by H−, and on grain surfaces: ℛ = (kH-xe + kd). The reaction rates depend on the gas temperature, T, and ionization fraction, xe, taken to be 102 K and 10−4, respectively; they are written6 as kH- = 10−16T2 cm3 s−1 (Bovino et al. 2016), and  (Cazaux & Tielens 2004). We note that H2 formation on grains dominates when the dust-to-gas ratio is
 ![Mathematical equation: $\[\mathcal{D}\]$](/articles/aa/full_html/2024/09/aa50944-24/aa50944-24-eq20.png) ≳ 10−3.
≳ 10−3.
We compute the LW flux at time t, as FLW(t) = ![Mathematical equation: $\[\dot{N}_{\mathrm{LW}}(t) / 4 \pi r_S^2(t)\]$](/articles/aa/full_html/2024/09/aa50944-24/aa50944-24-eq21.png) , i.e. at the edge of the Strömgren sphere (of radius rS) produced by the stars, beyond which the gas becomes neutral. To determine rS we derive the intrinsic galaxy UV luminosity at 1500 Å, L1500(t), from the star formation rate (SFR ≡
, i.e. at the edge of the Strömgren sphere (of radius rS) produced by the stars, beyond which the gas becomes neutral. To determine rS we derive the intrinsic galaxy UV luminosity at 1500 Å, L1500(t), from the star formation rate (SFR ≡ ![Mathematical equation: $\[\dot{M}_{\star}\]$](/articles/aa/full_html/2024/09/aa50944-24/aa50944-24-eq22.png) ) via a conversion factor,
) via a conversion factor, ![Mathematical equation: $\[\mathcal{K}\]$](/articles/aa/full_html/2024/09/aa50944-24/aa50944-24-eq23.png) 1500 [L⊙/M⊙yr−1], whose value has been chosen so to match the one used by the ALMA REBELS survey (Bouwens et al. 2022b):
1500 [L⊙/M⊙yr−1], whose value has been chosen so to match the one used by the ALMA REBELS survey (Bouwens et al. 2022b): ![Mathematical equation: $\[\mathcal{K}\]$](/articles/aa/full_html/2024/09/aa50944-24/aa50944-24-eq24.png) 1500 = L1500/SFR = 0.587 × 10¹⁰. We then convert the UV luminosity into an ionizing photon rate multiplying L1500 by the ionization parameter, ξion = 1025.7 in erg−1 Hz (Bunker et al. 2023).
1500 = L1500/SFR = 0.587 × 10¹⁰. We then convert the UV luminosity into an ionizing photon rate multiplying L1500 by the ionization parameter, ξion = 1025.7 in erg−1 Hz (Bunker et al. 2023).
The photon rate ![Mathematical equation: $\[\dot{N}_{\mathrm{LW}}(t)\left[\mathrm{s}^{-1}\right]\]$](/articles/aa/full_html/2024/09/aa50944-24/aa50944-24-eq25.png) (is computed by integrating over the SFH:
(is computed by integrating over the SFH:
![Mathematical equation: $\[\dot{N}_{\mathrm{LW}}(t)=\int_{t(z 8)}^t \operatorname{SFR}\left(t^{\prime}\right) Q_{\mathrm{LW}}\left(t-t^{\prime}\right) d t^{\prime},\]$](/articles/aa/full_html/2024/09/aa50944-24/aa50944-24-eq26.png) (11)
(11)
where the LW band-averaged photon production rate, QLW, per solar mass of stars formed in a instantaneous burst at Z = 0.2 Z⊙ is taken from Starburst997 (Leitherer et al. 1999).
It is also useful to introduce the specific LW luminosity (in erg s−1 Hz−1), is computed by integrating the production rate over the SFH:
![Mathematical equation: $\[L_{\mathrm{LW}}(t)=\frac{h\langle \nu\rangle}{\Delta \nu} \dot{N}_{\mathrm{LW}}(t)\]$](/articles/aa/full_html/2024/09/aa50944-24/aa50944-24-eq27.png) (12)
(12)
where ⟨ν⟩ is the mean frequency of the LW energy band of width Δν. Finally, the LW intensity [erg s−1 cm−2 Hz−1 sr−1] at a distance r from the source and at time t is given by:
![Mathematical equation: $\[J_{\mathrm{LW}}(r, t)=\frac{L_{\mathrm{LW}}(t)}{16 \pi^2 r^2}.\]$](/articles/aa/full_html/2024/09/aa50944-24/aa50944-24-eq28.png) (13)
(13)
This is often conveniently expressed as JLW = 10−21 J21 ergs−1 cm−2 Hz−1 sr−1. As a reference, we will usually give the value of J21 at the virial radius of the galaxy, i.e. J21(rvir, t).
We finally define the feedback strength, fLW, as
![Mathematical equation: $\[f_{\mathrm{LW}}(t)=\max \left[0,\left(1-r_{\text {sh }} / r_{\text {vir }}\right)\right].\]$](/articles/aa/full_html/2024/09/aa50944-24/aa50944-24-eq29.png) (14)
(14)
This choice is motivated by the fact that for an isothermal distribution of the gas in the halo gravitational potential, Mg ∝ r. Hence, fLW quantifies the fraction of the total gas mass in which star formation is inhibited by the effects of UV radiation. We also impose that LW feedback acts with a delay time, tD, which represents a free parameter of our model that must be calibrated from data (see Sec. 4). As a consequence, the feedback strength is evaluated at a retarded time, fLW(t − tD) in Eq. (3).
3.2 Radiation-driven outflows
In addition to suppressing star formation, radiation can drive outflows by transferring the momentum of the photons to the dust and gas (these two components are tightly coupled by viscous and Coulomb drag forces). In a dusty medium, the classical Eddington luminosity LE = 4πGmpcM*/σT = 1.26 × 1038(M*/M⊙)erg s−1 is reduced by a boost factor A = σd/σT, the ratio of the dust to Thomson cross-section, with A ≃ 100–1100, depending on dust abundance and properties. Given these uncertainties, for simplicity we scale A linearly with dust-to-gas ratio, i.e. A(![Mathematical equation: $\[\mathcal{D}\]$](/articles/aa/full_html/2024/09/aa50944-24/aa50944-24-eq30.png) ) = 1000(
) = 1000(![Mathematical equation: $\[\mathcal{D}\]$](/articles/aa/full_html/2024/09/aa50944-24/aa50944-24-eq31.png) /
/![Mathematical equation: $\[\mathcal{D}\]$](/articles/aa/full_html/2024/09/aa50944-24/aa50944-24-eq32.png) MW), deferring a more precise determination to future work (Nakazato et al. in prep.).
MW), deferring a more precise determination to future work (Nakazato et al. in prep.).
Ferrara (2024, see also Fiore et al. 2023) have shown that the modified super-Eddington condition, Lbol = fbolL1500 > A−1 LE, where the bolometric correction fbol = 2, can be cast into one on the specific star formation rate, sSFR = SFR/M*:
![Mathematical equation: $\[\mathrm{sSFR}>\mathrm{sSFR}^{\star} \simeq 25\left(\frac{100}{A}\right) \mathrm{Gyr}^{-1}.\]$](/articles/aa/full_html/2024/09/aa50944-24/aa50944-24-eq33.png) (15)
(15)
Eq. (15) represents the necessary condition for a galaxy to develop a radiation-driven outflow as soon as the galaxy sSFR crosses the sSFR* threshold.
We define the outflow rate as ![Mathematical equation: $\[W(t)=\eta \dot{M}_{\star}(t)\]$](/articles/aa/full_html/2024/09/aa50944-24/aa50944-24-eq34.png) , with the mass loading factor η = 0 if the galaxy is in the sub-Eddington regime, sSFR ≤ sSFR*; η is, in principle, a time-dependent function of several quantities (see below). The mass loading factor is included into Eqs. (2) and (4), where it is evaluated at a retarded time t − tD. As a precise determination of η is difficult both observationally and from numerical simulations (Muratov et al. 2015; Pallottini et al. 2022), we choose to leave it as a free parameter of the model. Nevertheless, it is instructive to obtain at least a crude estimate of η from physical arguments.
, with the mass loading factor η = 0 if the galaxy is in the sub-Eddington regime, sSFR ≤ sSFR*; η is, in principle, a time-dependent function of several quantities (see below). The mass loading factor is included into Eqs. (2) and (4), where it is evaluated at a retarded time t − tD. As a precise determination of η is difficult both observationally and from numerical simulations (Muratov et al. 2015; Pallottini et al. 2022), we choose to leave it as a free parameter of the model. Nevertheless, it is instructive to obtain at least a crude estimate of η from physical arguments.
The momentum injection rate due to stellar radiation is
![Mathematical equation: $\[W(t) v(t)=f(\tau) \frac{L_{\mathrm{bol}}(t)}{c},\]$](/articles/aa/full_html/2024/09/aa50944-24/aa50944-24-eq35.png) (16)
(16)
where υ is the outflow shell velocity, and
![Mathematical equation: $\[f(\tau)=\left(1-e^{-\tau_{1500}}\right)+\tau_{\mathrm{IR}}\]$](/articles/aa/full_html/2024/09/aa50944-24/aa50944-24-eq36.png) (17)
(17)
is a function of the UV (1500 Å) and IR optical depths (Thompson et al. 2015; Ishibashi et al. 2018; Costa et al. 2018). The first term in Eq. (17) accounts for single-scattering momentum transfer; the second one quantifies the momentum exchange between trapped IR radiation and the outflow. By substituting the expression for Lbol = fbol![Mathematical equation: $\[\mathcal{K}\]$](/articles/aa/full_html/2024/09/aa50944-24/aa50944-24-eq37.png) 1500SFR, and recalling the definition of η above, we find
1500SFR, and recalling the definition of η above, we find
![Mathematical equation: $\[\eta \equiv \frac{W}{\mathrm{SFR}}=236 f(\tau)\left(\frac{v}{\mathrm{~km} \mathrm{~s}^{-1}}\right)^{-1}.\]$](/articles/aa/full_html/2024/09/aa50944-24/aa50944-24-eq38.png) (18)
(18)
Hence, large values of η are achievable if f(τ) ≫ 1 and/or for low velocities. These conditions are likely to be met at the onset of the outflow, when the galaxy just became super-Eddington.
Additionally, it is noteworthy that very large values, up to η ≈ 1000, are also observed for classical, SN-driven outflows in low-mass galaxies (Muratov et al. 2015). However, it is advisable not to extend this comparison further, considering the significant differences in the underlying physics between these two cases. A precise determination of η is beyond the scope of the present study and necessitates radiation-hydrodynamics simulations, which we defer to future work.
4 Results
To avoid the awkwardness of general terms, and to elucidate some unique features of the SFH of super-early systems, we will use the recently discovered z = 14.32 (cosmic age 294 Myr) galaxy GS-z14-0 as a guiding example. However, the results can be used to understand the earliest galaxy population at large.
With an observed UV luminosity MUV = −20.8, and a stellar mass log(M*/M⊙) ≃ 8.7 (Carniani et al. 2024), GS-z14-0 has a star formation rate (averaged over the last 10 Myr) SFR ≈ 22 M⊙ yr−1. We use our model to highlight the key evolutionary features of this dazzling system. However, the results can be used to understand the earliest galaxy population at large.
Fig. 1 shows the SFH (blue line/shaded area) of GS-z14-0 as a function of the lookback time, tlook, from z = 14.32. This track corresponds to the fiducial values of the free parameters: M = 8 × 10¹¹ M⊙, tD = 40 Myr, and η = 158. For comparison, we also show the SFH when both the LW and the outflow are turned-off (gray, dashed). We identify six evolutionary phases (a)-(f), which are dominated by different physical processes. They are discussed in the following.
(a) The onset of star formation. The galaxy started to form stars as its halo reached a mass of 108 M⊙, thus enabling Lyα cooling of the gas; this happened at tlook = 170 Myr or z8 = 26.7. Since then, in a time ≈tD, the SFR increased from 10−3 to 0.3 M⊙ yr−1. Due to the parallel increase of the LW radiation field, reaching an intensity J21 ≈ 300, star formation was totally quenched in the entire galaxy by the inability of gas to self-shield. The little amount of dust formed by this first SF episode, corresponding to ![Mathematical equation: $\[\mathcal{D}\]$](/articles/aa/full_html/2024/09/aa50944-24/aa50944-24-eq39.png) = 10−4, was in fact insufficient to provide the minimum opacity to prevent the quenching. The amount of stars produced by this first burst is only 0.05% of the stars observed at z = 14.32.
= 10−4, was in fact insufficient to provide the minimum opacity to prevent the quenching. The amount of stars produced by this first burst is only 0.05% of the stars observed at z = 14.32.
(b) The earliest quenched phase. At tlook = 130 Myr the galaxy stop forming stars for about 20 Myr. During this period, cosmological accretion continued. The infall of virtually pristine, dust-free gas diluted the metals and the dust, thus decreasing Z (![Mathematical equation: $\[\mathcal{D}\]$](/articles/aa/full_html/2024/09/aa50944-24/aa50944-24-eq40.png) ) by a factor 3 (6).
) by a factor 3 (6).
At the same time, the UV/LW radiation field became less intense as a result of the passive ageing of the stellar population. At tlook = 110 Myr, J21 was weak enough that rsh < rvir, thus allowing for a re-ignition of star formation. At this stage the metallicity is ≈ 10−3 Z⊙, and the galaxy has always been optical thin (AV ≪ 1) throughout the previous evolution.
(c) From bursty to continuous star formation. Due to the large reservoir (Mg ≈ 2 × 10⁹ M⊙) of gas accumulated during the quenched phase, the SFR starts again vigorously, and in about 20 Myr it reaches the level expected in the absence of feedback (4 M⊙ yr−1). We note that the star formation efficiency is nevertheless small, ϵ* = 3.5%. As a result, the metal and dust mass, along with J21, increases again. However, their level is not yet sufficient to fully self-shield the galaxy as the retarded effect of the dust dilution due to accretion in phase (b) stops the SFR again.
This second stop, however, is relatively short and lasts only for 15 Myr. After this second burst the stellar mass is 1% of its final value. Quite importantly, though, dust produced during this event has for the first time significantly obscured the galaxy (AV = 1–3) before being slightly diluted again by accretion.
At the end of the second quenched period, when the halo mass is M ≈ 8 × 10¹⁰ M⊙ and the metallicity is ≈0.01 Z⊙, the bursty phase ends, and the galaxy relaxes onto a continuous star formation mode. Hence, although remarkable, the initial bursty phases induced by the LW feedback leave little imprints on the final properties of the galaxy, as we will discuss below. However, galaxies in these initial (z ≳ 18) bursty phases can be detected by JWST. In fact, the brightest magnitudes of the galaxy during the first and second burst are MUV = −16.1 (at z = 21.8) and MUV = −18.4 (at z = 20.3), thus opening the exciting perspective to observe the very first phases of galaxy formation, and even the first Pop III stars.
The above finding in not necessarily in tension with the reported non-detection of galaxies at z = 16–20 (Robertson et al. 2023), as the predicted magnitudes are below the detection limit of their survey. In the stacked images they reach as deep 31.4 AB mag, which at z = 20.3, where the brightest bursty phase of a galaxy like GS-z14-0 occurs, would correspond to a magnitude of MUV = −20.5, which is shallower than the predicted MUV = −18.4. Deeper surveys will be able to test this prediction.
(d) The main star-forming period. As the galaxy grows in mass and size, from tlook = 70 Myr the SFR approaches 17 M⊙ yr−1 and steadily increases up to a dazzling 100 M⊙ yr−1. The LW feedback is virtually de-activated by the ability of the galaxy to self-shield via dust opacity, and the galaxy basically follows the no-feedback track. The gas density is extremely high, n ≃ 3 × 104 cm−3, thus ensuring that SN kinetic energy is catastrophically radiated away.
This phase marks the main star forming period of the galaxy during which about 70% of all its stars are formed. We note that about one third (27%) of the final stellar mass is assembled in the last free-fall time, tff = 26.3 Myr, before observation. A key point is that this stellar build-up phase is completely obscured, as the large dust mass (Md ≃ 1.7 × 10⁶ M⊙) and concentration (re = 150 pc) at tlook = tff produces a very large (τV ≳ 50) attenuation of the galaxy luminosity, rendering it essentially unobservable to JWST (but possibly not to ALMA).
(e) The super-Eddington outflow phase. Given that GS-z14-0 is observed at z = 14.32 to be bright and blue (UV slope β = −2. 2), the previous obscured phase must have come to an end. Indeed, the model predicts that during phase (d) the galaxy became super-Eddington at tlook ≈ 66 Myr. Thus, after a time tD, or about 26 Myr before observation, a powerful outflow develops inducing a dramatic decrease in the gas and dust content. As a consequence the SFR drops from 100 to 15 M⊙ yr−1, and slightly rising thereafter. We pause to underline that, differently from LW feedback which was inducing a bursty behavior, radiation-driven outflows do not quench SFR completely, but they rather gradually decrease and control it.
Outflows play also another fundamental role: by dispersing dust (and metals) they lower the dust opacity, thus making the galaxy bluer and bright. In the absence of outflows, the dust mass (≈106 M⊙) synthesized by the observed stars in GS-z14-0 before the outflow, would be still co-located with stars, i.e. within re ≈ 145 pc. Such high dust surface density of ≈ 5 × 10⁷ M⊙kpc−2) would produce an τV ≃ 100. Outflows instead push the dust (and gas) to large radii and into the circumgalactic medium, without necessarily expelling it beyond rvir, but dramatically decreasing its optical depth and AV. As a result, they make the galaxy brighter – naturally explaining (Ferrara 2024) the overabundance of super-early galaxies deduced from the UV luminosity functions (see, e.g. McLeod et al. 2023, and references therein) – and bluer, as observed.
(f) The post-starburst, observed phase. Following the reduction of the SFR, the galaxy settles into a sub-Eddington regime8 and the outflow ceases. Contrary to the LW feedback recovery phase, the subsequent SFR increase is gradual. This is because the galaxy has been significantly devoided by its gas by the outflow, and it has to rely on accretion (acting on longer timescales) to replenish its reservoir. We conclude that GS-z14-0 is seen in such a post-starburst (or better, post-outflow) phase.
Our model nicely reproduces all the observed quantities (see Table 1), predicting SFR = 19.6 M⊙ yr−1, log(M*/M⊙) = 8.95, AV = 0.34, log(Z/Z⊙) = −2.2. We stress that this agreement should not be over-emphasized as at least some of the “observed” values have been deduced from a SED fitting procedure which requires specific assumptions about the shape of the SFH, which is in general different from the one predicted by our model.
When normalized to final halo mass, the mean conversion efficiency of the cosmologically available gas (fbM) into stars is ⟨ϵ*⟩ = 0.7%. The mass-weighted age of the stellar population is ⟨t⟩M = 36 Myr, i.e. only slightly larger than the free-fall time tff(z = 14.32); such quantity contains important information on the non-monotonic SFH of the galaxy. The luminosity-weighted age is instead, as expected, shorter, ⟨t⟩L = 18.9 Myr. We finally predict the F4200/F3500 Balmer break to be B = 2.02.
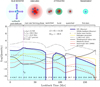 |
Fig. 1 Evolutionary tracks of key physical quantities of GS-z14-0 as a function of the lookback time from z = 14.32 corresponding to the fiducial values of the free parameters: M = 8 × 10¹¹ M⊙, tD = 40 Myr, η = 158. As indicated in the legend, we show the SFH (blue thick line/shaded area), SFH with no feedback (gray dashed), the stellar mass fraction with respect to its final value (starred yellow), the Eddington parameter equiv; SFR/SFR* (thick yellow), the LW intensity at rvir (dashed black), the shielding/virial ratio, rsh/rvir (thick black), the metallicity (orange), dust-to-gas ratio, and AV. The units for each quantity are reported in the legend. Also shown are the derived values for the fraction of stars formed before a free-fall time at z = 14.32, f*(tff), the mass- (luminosity-) weighted mean ages of the stellar population, ⟨t⟩M (⟨t⟩L), the gas-to-stars conversion factor, ⟨ϵ*⟩, and the Balmer break strength, B. The top sketch schematically represents the evolutionary phases discussed in Sec. 4. |
Measured and model predicted properties of the galaxy GS-z14-0 at z = 14.32.
Predicted spectrum
Using the SFH shown in Fig. 1, complemented with the predicted ionization parameter, U ≈ −1.2, we finally calculate the observed spectrum of GS-z14-0, shown in Fig. 2. To this aim we use the SED fitting code BAGPIPES (Carnall et al. 2018). Due to the low metallicity, the spectrum is essentially featureless, showing no prominent nebular lines, with the only exception of a weak CIII]Λ1907, 1909 line with an equivalent width EW ≈ 4.4 Å. The UV spectral slope is β = −2.25, in excellent agreement with the observed one β = −2.2 ± 0.07.
The spectrum in the MIRI band show luminous Hβ and [OIII]λλ4959, 5007 lines, which are therefore likely responsible for the flux excess measured by Helton et al. (2024) in the 7.7 μm filter. We note that, due to the low predicted metallicity Z ≈ 0.01 Z⊙, the [OIII]/Hβ line ratio is also low ≈ 0.5. Such ratio is nevertheless very sensitive to the precise value of Z. For example, if we artificially increase the predicted metallicity to Z = 0.03, it increases to 1.6.
5 Discussion
We have shown that the SFH of GS-z14-0, a luminous, blue galaxy at z = 14.32, is complex and undergoes different phases. LW feedback, via H2 molecule photo-dissociation, induces a very bursty onset of star formation at z ≃ 27. As the galaxy grows the SFH becomes smoother, but the extremely compact size (≈100 pc) causes it to become heavily obscured and unobservable by JWST. It is only when the galaxy enters a super-Eddington phase that outflows can push the dust to large radii, reducing attenuation and allowing UV photons to be observed. This scenario has several implications.
5.1 Stochasticity
Our model confirms that there should be a considerable SFR stochasticity (Mirocha & Furlanetto 2023; Shen et al. 2023; Pallottini & Ferrara 2023; Sun et al. 2023; Ciesla et al. 2023) in early galaxies due to LW feedback and outflows. However, higher fluctuations are expected during the initial phases when LW dominates and star formation is completely choked for tens of Myr. Outflows produce less extreme, by yet rapid, changes (see below) in the SFR once the galaxy becomes super-Eddington. Bursty SFH resulting from LW feedback has been identified in high-resolution simulations, such as the SERRA ones (Pallottini et al. 2022, the so-called “Alyssum effect” discussed in their Sect. 3.1.1). We point out that in addition to LW feedback, photoionization might also induce SFR stochasticity. This was initially suggested by Pawlik et al. (2013), and recently confirmed by Pallottini & Ferrara (2023). Other simulations (Jeon et al. 2015) find a similar behavior, but the comparison is not conclusive as they considered lower mass galaxies (halo mass 108 M⊙ at z = 10).
5.2 Obscured star formation
We find that a substantial fraction of the stellar mass build-up process might be obscured. For GS-z14-0, we find that 61% of its stars were formed with AV > 3. This phase lasted for about 30–40 Myr, corresponding to ≈ 20% of its active star forming phase, and was terminated by the onset of the outflow.
These results imply that a substantial number of FIR sources should be present at high-z. Just before the beginning of the outflow phase (z = 15.3), with Md ≃ 106 M⊙, a simple estimate for the expected continuum emission at restframe 88 μm for GS-z14-0 gives a flux F88 = (12, 31, 54) μJy for a dust temperature Td = (60, 80, 100) K, respectively. These flux levels can be detected by ALMA in a reasonable observation time9. These estimates are in agreement with those obtained by De Rossi & Bromm (2023). Hints of such an obscured galaxy population might have already been found in the candidates discussed by Rodighiero et al. (2023).
At the observed redshift (z = 14.32) the dust in the galaxy has decreased to a mere Md = 3 × 10⁴ M⊙. Even for Td = 100 K, F88 < 2 μJy. As most of the dust has been ejected in the circumgalactic medium, where Td might be close to the CMB temperature, its emission might be harder to detect. More detailed calculations are required to assess the detectability in this case.
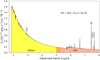 |
Fig. 2 Predicted spectrum of GS-z14-0 based on the SFH of the galaxy shown in Fig. 1, and for an ionization parameter U = −1.2. The spectrum has been computed using BAGPIPES (Carnall et al. 2018). It has a UV spectral slope β = −2.25; the position of the CIII]λ1907, 1909 line is indicated, along with those potentially detected by MIRI (Helton et al. 2024). |
5.3 Smouldering star formation
Radiation-driven outflows are launched immediately after the galaxy luminosity crosses the Eddington limit. In our treatment this is equivalent to impose sSFR > sSFR*. Although the precise value of the threshold is uncertain, it is reasonable to assume that sSFR* ∝ 1/![Mathematical equation: $\[\mathcal{D}\]$](/articles/aa/full_html/2024/09/aa50944-24/aa50944-24-eq48.png) as the driving efficiency depends on the momentum transfer from UV photons to dust grains. Thus, as dust is carried out of the galaxy, the outflow fades away because sSFR* increases and the SFR starves due to the decreasing availability of gas.
as the driving efficiency depends on the momentum transfer from UV photons to dust grains. Thus, as dust is carried out of the galaxy, the outflow fades away because sSFR* increases and the SFR starves due to the decreasing availability of gas.
This is seen in the sudden 7× drop of the SFR in only 12 Myr, at 14 < tlook/Myr < 26. Such fast suppression of the SFR is almost impossible to achieve with SN feedback (Gelli et al. 2024). For this reason, radiation-driven outflows have been invoked to explain the properties of high-z quiescent galaxies (Gelli et al. 2023; Carnall et al. 2023; Looser et al. 2023).
Interestingly, Robertson et al. (2023, see their Fig. 20) find that roughly half of the objects in their JADES Origin Field survey indicate a peak or burst in their star formation rates ≈10 Myr before the observation epoch. This scenario is tantalizingly close to the one we are proposing here, with a an episode of “mini-quenching” following the onset of the radiation-driven outflow.
5.4 Blue monsters
Once the galaxy enters the post-starburst phase it is seen as a “blue monster”, namely a blue, luminous galaxy in which the light from young stars is basically unattenuated. The associated brightness increase (in spite of the fact that the post-starburst phase corresponds to a decrease of the SFR with respect to the obscured phase) is crucial to explain the overabundance of luminous, super-early galaxies (Ferrara et al. 2023; Fiore et al. 2023; Ziparo et al. 2023; Ferrara 2024) deduced from the non-evolving bright-end of the UV LF (McLeod et al. 2023; Finkelstein et al. 2023; Donnan et al. 2024).
We note that in the post-starburst phase the metallicity also decreases. For GS-z14-0 we predict a metallicity ≲ 0.01 Z⊙, which might explain the absence of strong emission lines observed in this (Carniani et al. 2024) and other (Curtis-Lake et al. 2023) sources at z > 10. The case of other galaxies like GN-z11 (Bunker et al. 2023) or GHZ2 (Castellano et al. 2024), which show prominent UV/optical lines, might instead indicate that these systems are still at the beginning of the post-starburst phase or that the outflow has been less efficient.
5.5 Stellar ages
GS-z14-0 forms 90% of its stars in the last 50 Myr (Fig. 1), with a mass-weighted stellar age of 36 Myr, only slightly larger than the free-fall time at the observed redshift z = 14.32. The SFH is in general increasing with time, following the growth of the dark matter halo, but there are periods in which the SFR is either quenched or smouldering. During these periods the SFR might be instead decreasing with time. This on-monotonic behavior might bias low age estimates using constantly increasing (or constant) priors on the SFH. However, non-parametric SED fitting procedures might well catch these more complex SFHs (for an example, see Robertson et al. 2023). The presence of moderately older stars (e.g., those formed in the obscured phase 25–70 Myr before observation) results in a relatively high Balmer break, B ≈ 2. This indicator might be important to constrain the likely complex nature of SFH in super-early galaxies (Vikaeus et al. 2024; Roberts-Borsani et al. 2024; Langeroodi & Hjorth 2024). At z > 10 this measurement will have to rely on JWST MIRI observations.
6 Summary
We have modelled the SFH of super-early galaxies, and applied the results to the most distant, spectroscopically confirmed galaxy GS-z14-0 at z = 14.32. The main results are:
The SFH, starting at z = 26.7, is complex. The initial (z > 18), LW feedback-regulated phases are bursty, relatively faint (reaching MUV = −18.4) and unattenuated, hence at reach of deep JWST surveys. When dust shielding enables a smooth SFR, the galaxy quickly gets heavily obscured. In such an obscured phase, lasting for ≈20% of the entire active star forming time, about 70% of all its stars are formed. Super-early galaxies in this phase should be detectable by ALMA.
As the galaxy becomes super-Eddington, 26 Myr prior to observation, a powerful radiation-driven outflow clears most of the dust levitating it into the circumgalactic medium, and reduces the metallicity to Z ≈ 0.01 Z⊙. The outflow also “mini-quenches” the SFR by 7 times, from 100 → 15 M⊙ yr−1. The galaxy becomes a “blue monster”, thus contributing to the enhancement of the bright-end of the UV LF.
As the outflow ceases due to decreased dust opacity, the galaxy relaxes into a post-starburst phase in which it is currently observed (Carniani et al. 2024). Our model nicely reproduces all the observed quantities (see Tab. 1), predicting SFR = 19.6 M⊙ yr−1, log(M*/M⊙) = 8.95, AV = 0.34, log(Z/Z⊙) = −2.2. The mass-weighted age of the stellar population is ⟨t⟩M = 36 Myr. We finally predict the F4200/F3500 Balmer break to be B = 2.02.
Acknowledgements
We thank S. Carniani, C. Conselice, S. Gallerani, M. Kohandel, V. Markov, P. Oesch, A. Pallottini, E. Parlanti for useful discussions, data and comments. This work is supported by the ERC Advanced Grant INTERSTELLAR H2020/740120. Plots in this paper produced with the MATPLOTLIB (Hunter 2007) package for PYTHON.
References
- Adams, N. J., Conselice, C. J., Ferreira, L., et al. 2023, MNRAS, 518, 4755 [Google Scholar]
- Austin, D., Conselice, C. J., Adams, N. J., et al. 2024, arXiv e-prints [arXiv:2404.10751] [Google Scholar]
- Baldwin, J. O., Nelson, E., Johnson, B. D., et al. 2024, RNAAS, 8, 29 [Google Scholar]
- Bouwens, R. J., Stefanon, M., Brammer, G., et al. 2022a, arXiv e-prints [arXiv:2211.02607] [Google Scholar]
- Bouwens, R. J., Smit, R., Schouws, S., et al. 2022b, ApJ, 931, 160 [NASA ADS] [CrossRef] [Google Scholar]
- Bovino, S., Grassi, T., Capelo, P. R., Schleicher, D. R. G., & Banerjee, R. 2016, A&A, 590, A15 [NASA ADS] [CrossRef] [EDP Sciences] [Google Scholar]
- Bunker, A. J., Saxena, A., Cameron, A. J., et al. 2023, A&A, 677, A88 [NASA ADS] [CrossRef] [EDP Sciences] [Google Scholar]
- Carnall, A. C., McLure, R. J., Dunlop, J. S., & Davé, R. 2018, MNRAS, 480, 4379 [Google Scholar]
- Carnall, A. C., McLeod, D. J., McLure, R. J., et al. 2023, MNRAS, 520, 3974 [NASA ADS] [CrossRef] [Google Scholar]
- Carniani, S., Hainline, K., D’Eugenio, F., et al. 2024, arXiv e-prints [arXiv:2405.18485] [Google Scholar]
- Castellano, M., Napolitano, L., Fontana, A., et al. 2024, arXiv e-prints [arXiv:2403.10238] [Google Scholar]
- Cazaux, S., & Tielens, A. G. G. M. 2004, ApJ, 604, 222 [NASA ADS] [CrossRef] [Google Scholar]
- Ciesla, L., Elbaz, D., Ilbert, O., et al. 2024, A&A, 686, A128 [NASA ADS] [CrossRef] [EDP Sciences] [Google Scholar]
- Correa, C. A., Wyithe, J. S. B., Schaye, J., & Duffy, A. R. 2015, MNRAS, 450, 1521 [NASA ADS] [CrossRef] [Google Scholar]
- Costa, T., Rosdahl, J., Sijacki, D., & Haehnelt, M. G. 2018, MNRAS, 473, 4197 [Google Scholar]
- Cullen, F., McLure, R. J., McLeod, D. J., et al. 2023, MNRAS, 520, 14 [NASA ADS] [CrossRef] [Google Scholar]
- Curtis-Lake, E., Carniani, S., Cameron, A., et al. 2023, Nat. Astron., 7, 622 [NASA ADS] [CrossRef] [Google Scholar]
- Da Cunha, E., Groves, B., Walter, F., et al. 2013, ApJ, 766, 13 [NASA ADS] [CrossRef] [Google Scholar]
- De Rossi, M. E., & Bromm, V. 2023, ApJ, 946, L20 [NASA ADS] [CrossRef] [Google Scholar]
- Dekel, A., Sarkar, K. S., Birnboim, Y., Mandelker, N., & Li, Z. 2023, MNRAS, 523, 3201 [NASA ADS] [CrossRef] [Google Scholar]
- Donnan, C. T., McLure, R. J., Dunlop, J. S., et al. 2024, arXiv e-prints [arXiv:2403.03171] [Google Scholar]
- Eisenstein, D. J., Johnson, B. D., Robertson, B., et al. 2023, arXiv e-prints [arXiv:2310.12340] [Google Scholar]
- Ferrara, A. 2024, A&A, 684, A207 [NASA ADS] [CrossRef] [EDP Sciences] [Google Scholar]
- Ferrara, A., & Tolstoy, E. 2000, MNRAS, 313, 291 [NASA ADS] [CrossRef] [Google Scholar]
- Ferrara, A., Salvadori, S., Yue, B., & Schleicher, D. 2014, MNRAS, 443, 2410 [NASA ADS] [CrossRef] [Google Scholar]
- Ferrara, A., Vallini, L., Pallottini, A., et al. 2019, MNRAS, 489, 1 [Google Scholar]
- Ferrara, A., Pallottini, A., & Dayal, P. 2023, MNRAS, 522, 3986 [NASA ADS] [CrossRef] [Google Scholar]
- Finkelstein, S. L., Leung, G. C. K., Bagley, M. B., et al. 2023, arXiv e-prints [arXiv:2311.04279] [Google Scholar]
- Fiore, F., Ferrara, A., Bischetti, M., Feruglio, C., & Travascio, A. 2023, ApJ, 943, L27 [NASA ADS] [CrossRef] [Google Scholar]
- Gelli, V., Salvadori, S., Ferrara, A., Pallottini, A., & Carniani, S. 2023, ApJ, 954, L11 [NASA ADS] [CrossRef] [Google Scholar]
- Gelli, V., Salvadori, S., Ferrara, A., & Pallottini, A. 2024, ApJ, 964, 76 [NASA ADS] [CrossRef] [Google Scholar]
- Glover, S. C. O., & Clark, P. C. 2012, MNRAS, 421, 9 [NASA ADS] [Google Scholar]
- Harikane, Y., Nakajima, K., Ouchi, M., et al. 2023a, arXiv e-prints [arXiv:2304.06658] [Google Scholar]
- Harikane, Y., Ouchi, M., Oguri, M., et al. 2023b, ApJS, 265, 5 [NASA ADS] [CrossRef] [Google Scholar]
- Helton, J. M., Rieke, G. H., Alberts, S., et al. 2024, arXiv e-prints [arXiv:2405.18462] [Google Scholar]
- Hunter, J. D. 2007, Comput. Sci. Eng., 9, 90 [NASA ADS] [CrossRef] [Google Scholar]
- Inayoshi, K., Harikane, Y., Inoue, A. K., Li, W., & Ho, L. C. 2022, ApJ, 938, L10 [NASA ADS] [CrossRef] [Google Scholar]
- Ishibashi, W., Fabian, A. C., Ricci, C., & Celotti, A. 2018, MNRAS, 479, 3335 [CrossRef] [Google Scholar]
- Isobe, Y., Ouchi, M., Nakajima, K., et al. 2023, ApJ, 956, 139 [NASA ADS] [CrossRef] [Google Scholar]
- Jeon, M., Bromm, V., Pawlik, A. H., & Milosavljević, M. 2015, MNRAS, 452, 1152 [NASA ADS] [CrossRef] [Google Scholar]
- Kimm, T., Haehnelt, M., Blaizot, J., et al. 2018, MNRAS, 475, 4617 [CrossRef] [Google Scholar]
- Krumholz, M. R., McKee, C. F., & Tumlinson, J. 2008, ApJ, 689, 865 [NASA ADS] [CrossRef] [Google Scholar]
- Langeroodi, D., & Hjorth, J. 2024, arXiv e-prints [arXiv:2404.13045] [Google Scholar]
- Leitherer, C., Schaerer, D., Goldader, J. D., et al. 1999, ApJS, 123, 3 [Google Scholar]
- Li, Z., Dekel, A., Sarkar, K. C., et al. 2024, A&A, in press, https://doi.org/10.1051/0004-6361/202348727 [Google Scholar]
- Liu, B., & Bromm, V. 2022, ApJ, 937, L30 [NASA ADS] [CrossRef] [Google Scholar]
- Looser, T. J., D’Eugenio, F., Maiolino, R., et al. 2023, arXiv e-prints [arXiv:2302.14155] [Google Scholar]
- Mason, C. A., Trenti, M., & Treu, T. 2023, MNRAS, 521, 497 [NASA ADS] [CrossRef] [Google Scholar]
- McLeod, D. J., Donnan, C. T., McLure, R. J., et al. 2023, arXiv e-prints [arXiv:2304.14469] [Google Scholar]
- Mirocha, J., & Furlanetto, S. R. 2023, MNRAS, 519, 843 [Google Scholar]
- Morishita, T., Stiavelli, M., Chary, R.-R., et al. 2024, ApJ, 963, 9 [NASA ADS] [CrossRef] [Google Scholar]
- Muratov, A. L., Kereš, D., Faucher-Giguère, C.-A., et al. 2015, MNRAS, 454, 2691 [NASA ADS] [CrossRef] [Google Scholar]
- Ono, Y., Harikane, Y., Ouchi, M., et al. 2022, arXiv e-prints [arXiv:2208.13582] [Google Scholar]
- Pallottini, A., & Ferrara, A. 2023, A&A, 677, L4 [NASA ADS] [CrossRef] [EDP Sciences] [Google Scholar]
- Pallottini, A., Ferrara, A., Gallerani, S., et al. 2022, MNRAS, 513, 5621 [NASA ADS] [Google Scholar]
- Pawlik, A. H., Milosavljević, M., & Bromm, V. 2013, ApJ, 767, 59 [NASA ADS] [CrossRef] [Google Scholar]
- Pizzati, E., Ferrara, A., Pallottini, A., et al. 2020, MNRAS, 495, 160 [Google Scholar]
- Planck Collaboration XVI. 2014, A&A, 571, A16 [NASA ADS] [CrossRef] [EDP Sciences] [Google Scholar]
- Pérez-González, P. G., Costantin, L., Langeroodi, D., et al. 2023, ApJL, 951, L1 [CrossRef] [Google Scholar]
- Rasmussen Cueto, E., Hutter, A., Dayal, P., et al. 2023, arXiv e-prints, [arXiv:2312.12109] [Google Scholar]
- Rémy-Ruyer, A., Madden, S. C., Galliano, F., et al. 2014, A&A, 563, A31 [Google Scholar]
- Roberts-Borsani, G., Treu, T., Shapley, A., et al. 2024, arXiv e-prints [arXiv:2403.07103] [Google Scholar]
- Robertson, B., Johnson, B. D., Tacchella, S., et al. 2023, arXiv e-prints [arXiv:2312.10033] [Google Scholar]
- Rodighiero, G., Bisigello, L., Iani, E., et al. 2023, MNRAS, 518, L19 [Google Scholar]
- Salvadori, S., & Ferrara, A. 2009, MNRAS, 395, L6 [NASA ADS] [Google Scholar]
- Shen, X., Vogelsberger, M., Boylan-Kolchin, M., Tacchella, S., & Kannan, R. 2023, arXiv e-prints [arXiv:2305.05679] [Google Scholar]
- Shibuya, T., Ouchi, M., & Harikane, Y. 2015, ApJS, 219, 15 [Google Scholar]
- Smith, A., Bromm, V., & Loeb, A. 2017, MNRAS, 464, 2963 [NASA ADS] [CrossRef] [Google Scholar]
- Sommovigo, L., Ferrara, A., Pallottini, A., et al. 2022, MNRAS, 513, 3122 [NASA ADS] [CrossRef] [Google Scholar]
- Sternberg, A., Le Petit, F., Roueff, E., & Le Bourlot, J. 2014, ApJ, 790, 10 [CrossRef] [Google Scholar]
- Stiavelli, M., Morishita, T., Chiaberge, M., et al. 2023, arXiv e-prints [arXiv:2308.14696] [Google Scholar]
- Sun, G., Faucher-Giguère, C.-A., Hayward, C. C., et al. 2023, ApJ, 955, L35 [CrossRef] [Google Scholar]
- Thompson, T. A., Fabian, A. C., Quataert, E., & Murray, N. 2015, MNRAS, 449, 147 [NASA ADS] [CrossRef] [Google Scholar]
- Tomaselli, G. M., & Ferrara, A. 2021, MNRAS, 504, 89 [NASA ADS] [CrossRef] [Google Scholar]
- Vikaeus, A., Zackrisson, E., Wilkins, S., et al. 2024, MNRAS, 529, 1299 [NASA ADS] [CrossRef] [Google Scholar]
- Willott, C. J., Desprez, G., Asada, Y., et al. 2024, ApJ, 966, 74 [NASA ADS] [CrossRef] [Google Scholar]
- Woosley, S. E., & Heger, A. 2007, Phys. Rep., 442, 269 [Google Scholar]
- Ziparo, F., Ferrara, A., Sommovigo, L., & Kohandel, M. 2023, MNRAS, 520, 2445 [NASA ADS] [CrossRef] [Google Scholar]
These include (a) star formation variability (Mason et al. 2023; Mirocha & Furlanetto 2023; Pallottini & Ferrara 2023), (b) reduced feedback resulting in a higher star formation efficiency (Dekel et al. 2023; Li et al. 2023), and (c) a top-heavy IMF (Inayoshi et al. 2022), although see Rasmussen Cueto et al. (2023). More exotic solutions involving primordial black holes have also been suggested (Liu & Bromm 2022)
Throughout the paper, we assume a flat Universe with the following cosmological parameters: ΩM = 0.3075, ΩΛ = 1 − ΩM, and Ωb = 0.0486, h = 0.6774, σ8 = 0.826, where ΩM, ΩΛ, and Ωb are the total matter, vacuum, and baryon densities, in units of the critical density; h is the Hubble constant in units of 100 km s−1 Mpc−1, and σ8 is the late-time fluctuation amplitude parameter (Planck Collaboration XVI 2014).
We assume the Instantaneous Recycling Approximation (IRA).
For reference, when averaged over 8 < log(M0/M⊙) < 14, (α, β) = (0.25, −0.75).
We assume that accreted gas is metal-free.
We use the compact notation Yx = Y/10x.
In spite of the high observed sSFR= ![Mathematical equation: $\[45_{-35}^{+56}\]$](/articles/aa/full_html/2024/09/aa50944-24/aa50944-24-eq49.png) Gyr−1, due to its low
Gyr−1, due to its low ![Mathematical equation: $\[\mathcal{D}\]$](/articles/aa/full_html/2024/09/aa50944-24/aa50944-24-eq50.png) , according to Eq. (15), GS-z14-0 is not super-Eddington.
, according to Eq. (15), GS-z14-0 is not super-Eddington.
A potential challenge is nevertheless represented by the CMB, whose high temperature, TCMB(z = 14.32) = 41.8 K, might partially or even entirely suppress the dust signal (Da Cunha et al. 2013; Sommovigo et al. 2022).
All Tables
All Figures
|
Fig. 1 Evolutionary tracks of key physical quantities of GS-z14-0 as a function of the lookback time from z = 14.32 corresponding to the fiducial values of the free parameters: M = 8 × 10¹¹ M⊙, tD = 40 Myr, η = 158. As indicated in the legend, we show the SFH (blue thick line/shaded area), SFH with no feedback (gray dashed), the stellar mass fraction with respect to its final value (starred yellow), the Eddington parameter equiv; SFR/SFR* (thick yellow), the LW intensity at rvir (dashed black), the shielding/virial ratio, rsh/rvir (thick black), the metallicity (orange), dust-to-gas ratio, and AV. The units for each quantity are reported in the legend. Also shown are the derived values for the fraction of stars formed before a free-fall time at z = 14.32, f*(tff), the mass- (luminosity-) weighted mean ages of the stellar population, ⟨t⟩M (⟨t⟩L), the gas-to-stars conversion factor, ⟨ϵ*⟩, and the Balmer break strength, B. The top sketch schematically represents the evolutionary phases discussed in Sec. 4. |
| In the text | |
|
Fig. 2 Predicted spectrum of GS-z14-0 based on the SFH of the galaxy shown in Fig. 1, and for an ionization parameter U = −1.2. The spectrum has been computed using BAGPIPES (Carnall et al. 2018). It has a UV spectral slope β = −2.25; the position of the CIII]λ1907, 1909 line is indicated, along with those potentially detected by MIRI (Helton et al. 2024). |
| In the text | |
Current usage metrics show cumulative count of Article Views (full-text article views including HTML views, PDF and ePub downloads, according to the available data) and Abstracts Views on Vision4Press platform.
Data correspond to usage on the plateform after 2015. The current usage metrics is available 48-96 hours after online publication and is updated daily on week days.
Initial download of the metrics may take a while.