| Issue |
A&A
Volume 694, February 2025
|
|
|---|---|---|
| Article Number | A84 | |
| Number of page(s) | 7 | |
| Section | Interstellar and circumstellar matter | |
| DOI | https://doi.org/10.1051/0004-6361/202452372 | |
| Published online | 04 February 2025 | |
Polycyclic aromatic hydrocarbon and the ultraviolet extinction bump at the cosmic dawn
1
Hunan Key Laboratory for Stellar and Interstellar Physics and School of Physics and Optoelectronics, Xiangtan University,
Hunan
411105,
China
2
Department of Physics and Astronomy, University of Missouri,
Columbia,
MO
65211,
USA
3
Cosmic Dawn Center (DAWN),
Copenhagen,
Denmark
4
Niels Bohr Institute, University of Copenhagen,
Jagtvej 128,
2200
Copenhagen,
Denmark
★ Corresponding authors; This email address is being protected from spambots. You need JavaScript enabled to view it.
; This email address is being protected from spambots. You need JavaScript enabled to view it.
Received:
26
September
2024
Accepted:
19
December
2024
Abstract
Context. First detected in 1965, the mysterious ultraviolet (UV) extinction bump at 2175 Å is the most prominent spectroscopic feature superimposed on the interstellar extinction curve. Its carrier has remained unidentified over the six decades since its first detection, although many candidate materials have been proposed.
Aims. Widely seen in the interstellar medium of the Milky Way as well as several nearby galaxies, this bump was recently also detected by the James Webb Space Telescope (JWST) at the cosmic dawn in JADES-GS-z6-0, a distant galaxy at redshift z ≈ 6.71, corresponding to a cosmic age of just 800 million years after the big bang. Differing from that of the known Galactic and extragalactic interstellar sightlines, which always peak at ~2175 Å, the bump seen at z ≈ 6.71 peaks at an appreciably longer wavelength of ~2263 Å and is the narrowest among all known Galactic and extragalactic extinction bumps.
Methods. Here we show that the combined electronic absorption spectra quantum chemically computed for a number of polycyclic aromatic hydrocarbon (PAH) molecules closely reproduce the bump detected by JWST in JADES-GS-z6-0.
Results. This suggests that PAH molecules had already been pervasive in the Universe at an epoch when asymptotic giant branch stars had not yet evolved to make dust.
Key words: ISM: abundances / dust, extinction / ISM: molecules
© The Authors 2025
 Open Access article, published by EDP Sciences, under the terms of the Creative Commons Attribution License (https://creativecommons.org/licenses/by/4.0), which permits unrestricted use, distribution, and reproduction in any medium, provided the original work is properly cited.
This article is published in open access under the Subscribe to Open model. This email address is being protected from spambots. You need JavaScript enabled to view it. to support open access publication.
1 Introduction
First detected nearly six decades ago by Stecher (1965), the ultraviolet (UV) extinction bump at 2175 Å is the most prominent spectral feature on the interstellar extinction curve. Such a UV bump is widely seen in the Milky Way and nearby galaxies, including the Large Magellanic Cloud, several regions in the Small Magellanic Cloud, and M31 (see Henning & Schnaiter 1998, Draine 2003). Despite nearly 60 years of extensive observational, theoretical, and experimental studies, the exact carrier of the 2175 Å extinction bump remains unidentified. Although a variety of candidate materials have been proposed (see Wang et al. 2023 and references therein), consensus has yet to be reached.
Utilizing the Near Infrared Spectrograph (NIRSpec) on board JWST, Witstok et al. (2023) detect an extinction bump at the cosmic dawn in JADES-GS+53.15138-27.81917 (also known as JADES-GS-z6-0), a distant galaxy at redshift ɀ ≈ 6.71. This indicates that the bump carriers had already been pervasive in the Universe at a cosmic age of just 800 million years (Myr) after the big bang. At such an early epoch of cosmic time there was not enough time for low- to intermediate-mass stars (~0.5–8 M⊙) to evolve sufficiently to the dust-producing asymptotic giant branch (AGB) phase. The formation of the bump carriers during such a short (approximately 400 Myr) phase of stellar evolution provides valuable insight into the nature of the bump carriers, as well as the stellar evolution and dust condensation scenarios in the earliest epochs of the Universe. The 2175 Å bump has also been detected at the cosmic noon in galaxies at ɀ ≈1–2 (e.g., see Shivaei et al. 2022).
Immediately after its first detection (Stecher 1965), small graphite grains were proposed to be responsible for the 2175 Å extinction curve (Stecher & Donn 1965). However, as Li et al. (2024) demonstrate, graphitic grains fail to explain the UV bump detected in JADES-GS-z6-0, as the extinction bump arising from those grains is too broad and peaks at wavelengths that are too long to agree with what is seen in JADES-GS-z6-01. In this work, we show that the quantum chemically computed electronic absorption spectra of a large number of polycyclic aromatic hydrocarbon (PAH) molecules closely reproduce the UV extinction bump seen in JADES-GS-z6-0 at ɀ ≈ 6.71. This paper is organized as follows. In Sect. 2, we briefly describe the computational methods and target PAH molecules. The peak wavelengths and widths of the UV bumps calculated for the target molecules are also presented in Sect. 2. We describe in Sect. 3 how the computed electronic absorption spectra are utilized to model the UV extinction bump seen in JADES-GS-z6-0. The results are presented in Sect. 4 and discussed in Sect. 5. Our major conclusion is summarized in Sect. 6.
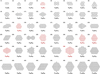 |
Fig. 1 Target PAH molecules for TD-DFT computations of their electronic transitions. |
2 Computational methods and target PAH molecules
We considered 48 PAH molecules spanning a wide range of sizes from 10 carbon (C) atoms (NC = 10; naphthalene, C10H8) to 150 C atoms (circumcircumcircumcoronene, C150H30). The sizes of these molecules are roughly evenly distributed, except for the largest ones with NC > 100. As illustrated in Fig. 1, most of these molecules have a compact, pericondensed structure. In the interstellar medium (ISM), pericondensed PAHs are structurally stable in terms of thermal and chemical properties among the various isomers.
It has been argued that only PAHs with NC ≳ 20 can survive in the ISM (see Tielens 2008). However, Stockett et al. (2023) find that nitrile-substituted naphthalene (i.e., cyanonaphthalene, C10H7CN) can be efficiently stabilized with the aid of the so-called recurrent fluorescence (also known as Poincaré fluorescence, see Léger et al. 1988), a radiative relaxation channel in which optical photons are emitted from thermally populated electronically excited states. Iida et al. (2022) also find that the recurrent fluorescence could efficiently stabilize small cationic carbon clusters with as few as nine carbon atoms. Indeed, a number of small, specific PAH molecules – indene (C9H8 ; Burkhardt et al. 2021, Cernicharo et al. 2021), cyanoindene (C9H7CN; Sita et al. 2022), cyanonapthalene (McGuire et al. 2021), and cyanopyrene (C16H9CN; Wenzel et al. 2024a,b) – as well as benzonitrile (C6H5CN; McGuire et al. 2018) have been discovered in the Taurus Molecular Cloud on the basis of their rotational transitions at radio frequencies. In addition, Gredel et al. (2011) searched for the electronic absorption fingerprints in the UV/visible wavelengths of small molecules including anthracene, phenanthrene, and pyrene, and derived upper limits on their abundances. Therefore, we included four molecules with NC < 20 in our sample. On the other hand, we did not consider molecules with more than 150 C atoms. First, these molecules are computationally expensive. Also, as will be shown later, larger molecules (with NC > 60) tend to shift their π* ← π electronic transitions to longer wavelengths. As the peak wavelengths of the π* ← π transitions of molecules with NC > 100 substantially deviate from the UV extinction bump seen in JADES-GS-z6-0, it is not necessary to consider molecules with NC > 150.
Unfortunately, there is a lack of experimental measurements of the UV/visible absorption spectra of gas-phase, intermediate-sized PAH molecules (with NC ~20–60). Even for small molecules (with NC < 20), gas-phase measurements are also very limited (e.g., see Gredel et al. 2011). Therefore, we relied on quantum chemical computations. However, the substantial quantity of electrons present in the PAH molecules under examination (reaching 930 in the largest molecule, circum- circumcircumcoronene) currently hinders any ab initio investigation that directly solves the many-electron Schrödinger equation, due to excessively high computational expenses. In this study, we resorted to density functional theory (DFT; Jones & Gunnarsson 1989) and its time-dependent version (TD- DFT; Marques & Gross 2004) to examine the ground-state and excited-state characteristics of PAHs2.
We first performed structure optimization utilizing the GAUSSIAN 16 software (Frisch et al. 2016). We used the hybrid density functional model (B3LYP) at the 6-31+G(d) level. This method provides sufficient calculation accuracy with operable computer time for large molecules. We simultaneously calculated the vibrational modes of each species to confirm that the optimized structures are at the minima of their potential energy surfaces.
We then used the real-space, real-time version of TD-DFT, as implemented in the code OCTOPUS (Marques et al. 2003), to compute the UV/visible electronic spectra of the optimized structures. We employed a real-space grid comprising overlapping spheres with a radius of 3 Å centered around each atom. All quantities were discretized in a uniform grid with a spacing of 0.3 Å. The time step for the time evolution was 0.002 ħ eV−1 (ħ is the reduced Planck constant), which ensures stability in the time-dependent propagation of the Kohn-Sham wave functions. Furthermore, the total propagation time was at least 20 ħ eV−1 .
For each molecule, we calculated the electronic absorption cross section, Cabs (λ). We then fitted the calculated Cabs (λ) by a Drude function combined with a Fano profile (see Lin et al. 2023). The peak position  and width
  of the Drude function characterize the electronic π* ← π transition, which resembles the UV extinction bump seen in the ISM. In Fig. 2 we show
  and
and  for each molecule.
In general, as shown in Fig. 2, the absorption bumps for the π* ← π transitions for larger PAH molecules (with NC > 60) tend to peak at somewhat longer wavelengths. In contrast, their bump widths are randomly distributed around γ = 1.0 µm−1, and the variation of the bump width with PAH size shows no systematic tendency. As will be elaborated on in Sect. 3, the extinction bump seen in JADES-GS-z6-0 is very narrow (at only half of the mean width of the Galactic bump) and “red” (which peaks at ~2263 Å, a wavelength appreciably longer than the Galactic nominal wavelength of ~2175 Å). In the following, we will confront the computed electronic absorption spectra of PAH mixtures with these observational characteristics to assess the viability of PAHs as a potential explanation for the extinction bump detected in JADES-GS-z6-0.
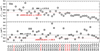 |
Fig. 2 Peak wavelengths and widths of π* ← π transitions of individual PAH species. Also shown are those of the Galactic average (horizontal, dashed black lines) and JADES-GS-z6-0 observed by JWST/NIRSpec (horizontal, dashed red lines). |
3 Extinction bump modeling
JADES-GS-z6 is a low-metallicity, normal star-forming galaxy with a subsolar metallicity of Z ≈ 0.2–0.3 Z⊙ (Witstok et al. 2023). The Balmer decrement demonstrates that this galaxy suffers significant dust obscuration. The rest-frame UV spectrum obtained by JWST/NIRSpec exhibits a pronounced dip at wavelength  , with a width (measured in wavelength) of Δλ ~250 Å (which corresponds to γ ~0.49 µm−1 in inverse wavelength). This dip resembles the interstellar UV extinction bump but shifting the nominal peak wavelength of 2175 Å to a somewhat longer wavelength. Its width is considerably narrower than the mean width of Δλ ~473 Å (or γ ~1 µm−1) of the Galactic ISM (Valencic et al. 2004). In the following, we shall still refer to this dip as the 2175 Å bump, despite the fact that it actually peaks at 2263 Å.
If we let  be the intrinsic, extinction-free flux emitted by JADES-GS-z6 at wavelength λ that would be “detected” by JWST, and
  be the dust-attenuated “model” flux expected to be observed by JWST/NIRSpec, then
  and
and  are related through
 (1)
(1)
where τλ is the optical depth at wavelength λ arising from the dust along the line of sight toward the region in JADES-GS-z6 observed by JWST. For a mixture of NPAH different PAH species, we derive the optical depth from
![Mathematical equation: ${\tau _\lambda } = {N_{\rm{H}}} \times {\left[ {{{\rm{C}} \over {\rm{H}}}} \right]_{{\rm{PAH}}}} \times \sum\limits_{j = 1}^{{N_{{\rm{PAH}}}}} {{\omega _j}} \left[ {{{{C_{{\rm{abs}},j}}(\lambda )} \over {{N_{{\rm{C}},j}}}}} \right],$](/articles/aa/full_html/2025/02/aa52372-24/aa52372-24-eq11.png) (2)
(2)
where NH is the hydrogen (H) column density for the interstellar sightline in JADES-GS-z6 observed by JWST, [C/H]gra is the total amount of C relative to H locked up in NPAH PAH species, Cabs, j(λ) is the absorption cross section computed for the j-th PAH species, NC, j is the number of C atoms contained in the j- th PAH species, and ωj is the fractional weight of the j-th PAH species.
To best reproduce  , the flux observed by JWST, we need to minimize
 (3)
(3)
where Ndata is the number of data points in the wavelength range of 1993.1-2488.7 Å where the UV extinction bump peaks, ω′ is the weight we introduced to enhance the fit to the bump, and  is the reduced observational uncertainty:
 (4)
(4)
where σobs,λ is the observational uncertainty. Over the wavelength range of 1993.1–2488.7 Å, the JWST/NIRSpec spectrum has 33 data points. If we consider all 48 PAH molecules in fitting  , we would have more model parameters than the number of data points. To avoid this, we preselected 17 (of 48) species for which γ < 1.0 µm−1 and
  < 4.6 µm−1 (see Fig. 2). In view of the fact that the bump seen in JADES-GS-z6-0 is very narrow (γ ≈ 0.49 µm−1) and peaks at an appreciably longer wavelength (~4.4 µm−1) than the Galactic UV bump, we made such a preselection to ensure that the computed UV bumps of these molecules were not too broad and their peak wavelengths were not too short. We adopted the following weight:
 (5)
(5)
where λ0 and Δλ are the peak wavelength and full width half maximum (FWHM) of the “2175 Å” UV extinction bump. While rather arbitrary, we designed such a weight to “force” the model spectrum to fit the bump observed in JADES-GS-z6-0, with increasing emphasis put on the data in the wavelength range closer to the bump peak.
By defining ηPAH = NH × [C/H]PAH, the best fit is achieved under the condition of
 (6)
(6)
and from Eq. (6) we derive
 (7)
(7)
![Mathematical equation: $ \times {\left\{ {\sum\limits_{i = 1}^{{N_{{\rm{data }}}}} {{{\left[ {{{\left\langle {{C_{{\rm{abs}}}}/{N_{\rm{C}}}} \right\rangle } \over {{{\sigma '}_{{\rm{obs}},\lambda }}}}} \right]}^2}} } \right\}^{ - 1}},$](/articles/aa/full_html/2025/02/aa52372-24/aa52372-24-eq21.png) (8)
(8)
where 〈Cabs/NC〉, the “mean” absorption cross section (per C atom), is obtained from averaging over that of all N different PAH species:
![Mathematical equation: $\left\langle {{C_{{\rm{abs}}}}/{N_{\rm{C}}}} \right\rangle = \sum\limits_{j = 1}^{{N_{{\rm{PAH}}}}} {{\omega _j}} \left[ {{{{C_{{\rm{abs}},j}}(\lambda )} \over {{N_{{\rm{C}},j}}}}} \right].$](/articles/aa/full_html/2025/02/aa52372-24/aa52372-24-eq22.png) (9)
(9)
4 Results
Following Witstok et al. (2023), we approximated the intrinsic spectrum by a power-law (PL) spectrum that fits the UV continuum observed by JWST/NIRSpec:
 (10)
(10)
We fitted the JWST/NIRSpec spectrum of JADES-GS-z6-0 by attenuating the PL spectrum with a weighted mixture of 17 PAH species. In the extinction bump fitting there are 18 model parameters: ηPAH, as well as the fractional weight, ωj, for the j-th molecule (where j = 1, 2, …, 17).
Figure 3a presents the best fit to the JWST/NIRSpec spectrum of JADES-GS-z6-0, as well as the derived fractional weights for individual PAH molecules. We see that a mixture of 17 PAH species can closely account for the UV extinction bump seen in JADES-GS-z6-0, with contributions predominantly from seven species (in order of decreasing weights): C64H20 (with a fractional weight of 24.9%±4.1%), C57H19  , C52H18
  , C59H19
  , C37H15 (10.8%±2.3%), C80H22 (9.5%±2.1%), and C19H11 (4.1%±1.6%). The remaining ten species in total account for <1% of the fractional weight. In Fig. 3b we show the fractional weights of those seven molecules that make the predominant contributions to the UV bump. None of the other (ten) species is shown in Fig. 3b since their fractional weights are all smaller than 0.1%.
Figure 3 clearly shows that the weighted sum of the electronic absorption spectra of individual PAH molecules fits both the peak wavelength and the width, as well as the overall profile of the UV extinction bump observed in the early Universe. The best fit derives ηPAH = NH × [C/H]PAH ≈ 2.34 × 1016 cm−2 and 〈NC〉 ≈ 53, the mean size of the PAH molecules (weighted by the relative abundances). We took an educated estimate for [C/H]PAH, the amount of C (relative to H) required by PAHs to account for the observed UV bump of JADES-GS-z6-0. By assuming that the amount of dust (relative to gas) is proportional to the metallicity, Z, of the galaxy and the dust size and composition are similar to that of the Galactic diffuse ISM, we estimated a gas-to-extinction ratio of NH/E(B − V) ≈ (Z⊙/.Z) × {NH/E(B − V)}MW ≈ 1.7 × 1022 cm−2 mag−1 for JADES-GS-z6- 0, where {NH/E (B − V)}MW ≈ 5.8 × 1021 cm−2 mag−1 is the mean gas-to-extinction ratio of the Milky Way (Bohlin et al. 1978) and Z ≈ 0.34 ± 0.05 Z⊙ is the metallicity of JADES-GS- z6-0 (Witstok et al. 2023). With E(B − V) ≈ 0.25 ± 0.07 mag (Witstok et al. 2023), we estimated NH ≈ 4.3 × 1021 cm−2 and this translates to [C/H]PAH ≈ 5.5 ppm, about ten times smaller than that of the Milky Way (i.e., [C/H]PAH ≈ 40–60 ppm, see Li & Draine 2001 and Lin et al. 2023)3.
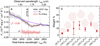 |
Fig. 3 Left panel a: fitting the rest-frame UV spectrum of JADES-GS-z6 measured by JWST/NIRSpec (solid gray-shaded line) with a power-law continuum (solid blue line) attenuated mainly by the absorption of PAH molecules (solid red line). The bottom orange-shaded line illustrates the fitting residual. Right panel b: the fractional weights of the molecules that best fit the JWST/NIRSpec spectrum of JADES-GS-z6. |
5 Discussion
To examine the uniqueness of the fit (especially the uniqueness of the role of individual PAH molecules), we explored whether satisfactory fits to the observed spectrum can still be achieved when one or more of the best-fitting seven molecules (see Fig. 3) is excluded. For this purpose, we repeated the UV bump fitting by minimizing χ2 (see Eqs. (3) and (7)) and excluding one or more molecules from the fitting. We first excluded C64H20 , the molecule with the highest fractional weight as derived above. As shown in Fig. 4a, a close fit can still be obtained if another molecule, that is, C54H18 (with a fractional weight of 24.7%), is included. Figure 4b shows that, if C57H19 (the second most abundant molecule among the seven best-fit molecules) is excluded, a close fit can also be obtained even without the inclusion of additional molecules.
We also considered the removal of C52H18 and C59H19. As the π* ← π bumps of these two molecules have similar peak wavelengths and widths, we simultaneously excluded both C52H18 and C59H19. As shown in Fig. 4c, a satisfactory fit to the observed UV bump can still be achieved with the remaining five molecules. This implies that the UV bump alone does not allow one to uniquely pinpoint to an individual molecule. It would be interesting to explore the infrared (IR) emission spectra of these molecules and see if the combination of the UV bump and the IR emission spectra can uniquely infer the presence of individual molecules and their abundances. Nevertheless, as shown in Fig. 4d, if all seven of the molecules are excluded, then no satisfactory fits can be obtained.
As mentioned earlier in Sect. 2, while the vibrational bands of PAHs in the IR are not molecule specific, their rotational transitions occurring in radio frequencies provide characteristic fingerprints. Indeed, a number of small PAH molecules (i.e., indene, cyanoindene, cyanonapthalene, and cyanopyrene), as well as benzonitrile, have been identified in space through their rotational lines. Similarly, individual PAH molecules have sharp absorption features in the UV and these electronic transitions are characteristic of the PAH molecular structure, so that they could potentially also allow for the identification of specific species (e.g., see Salama et al. 2011; Gredel et al. 2011). However, if PAHs are present in the ISM with a wide variety of molecules and ions, a blend of absorption bands from such a mixture of various species would smooth out the sharp features from individual PAH molecules, as demonstrated experimentally (see Joblin et al. 1992; Steglich et al. 2010, 2012). Indeed, the search for characteristic absorption features of individual PAHs superposed on the interstellar extinction curves was not successful (e.g., see Clayton et al. 2003; Gredel et al. 2011). Nevertheless, we stress that, although the UV bump does not allow us to uniquely identify individual molecules, as shown in Fig. 4d, if all seven molecules are excluded, then no satisfactory fits can be obtained.
We had thus far confined ourselves to a preselection of 17 (of 48) PAH species for which γ < 1.0 µm−1 and  < 4.6 µm−1. To examine the validity of this preselection, we also fitted the UV bump detected in JADES-GS-z6-0 in terms of a complete sample of all 48 PAH species. In this case, to ensure the number of data points would exceed the number of model parameters (Nmod = 49), we applied cubic spline interpolation to expand the original 33 data points to Ndata = 200. As shown in Fig. 5, the JWST/NIRSpec spectrum of JADES-GS-z6-0 is closely fitted by a mixture of 48 PAH species, with contributions predominantly from exactly the same seven species as those based on the mixture of 17 preselected molecules. However, the derived fractional weights of these molecules are different. This also indicates that the broad UV bump itself does not allow us to uniquely identify individual, specific molecules.
Finally, we note that PAHs are abundant and widespread in the Universe, as revealed by a distinctive set of emission bands at 3.3, 6.2, 7.7, 8.6, 11.3, and 12.7 µm (see Léger & Puget 1984; Allamandola et al. 1985; Tielens 2008; Li 2020). The 3.3 µm PAH emission has recently been detected by JWST’s Mid-IR Instrument (MIRI) in SPT0418-47 at ɀ ≈ 4.22, a galaxy observed less than 1.5 Gyr after the big bang (Spilker et al. 2023). However, the origin of PAHs (and dust) in JADES-GS-z6-0 is puzzling. If star formation began when the Universe was about 400 Myr old, at the epoch of JADES-GS-z6-0, even the oldest stars were only 400 Myr old. Therefore, there was not enough time for low- to intermediate-mass stars (about 0.5 to 8 M⊙) to evolve sufficiently to the dust-producing AGB phase. In the Milky Way, AGB stars dominate the production of stardust and, typically, it takes them one billion years to evolve. As only massive stars (with at least 8 M⊙) would have been able to evolve in such a short timescale (as that available for JADES-GS-z6-0), it is often suggested that supernovae were responsible for the dust in the first billion years of cosmic time. Nevertheless, reverse shocks from supernovae also destroy dust. Apparently, the detection of the extinction bump and the implied presence of PAHs in JADES-GS-z6-0 provide important insights into the stellar evolution and dust condensation scenarios in the earliest epochs of the Universe (see Yang & Li 2023).
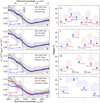 |
Fig. 4 Upper panels a, e: same as Fig. 3 but with C64H20 excluded and C52H18 added. Middle panels b, f: same as Fig. 3 but with C57 H19 excluded. Middle panels c, g: same as Fig. 3 but with C52 H18 and C59H19 excluded. Bottom panels d, h: same as Fig. 3 but with all those seven best-fitting molecules excluded. |
6 Summary
We reproduced the UV extinction bump detected by JWST/NIRSpec at the cosmic dawn in JADES-GS-z6-0 at redshift ɀ ≈ 6.71, with a mixture of compact, pericondensed PAH molecules of different sizes. The UV bump seen in JADES- GS-z6-0 is narrower than any known Galactic or extragalactic bump, and peaks at a wavelength considerably longer than the nominal central wavelength of 2175 Å. While small graphite grains predict a UV bump too broad to compare with that observed, the weighted sum of the electronic absorption spectra quantum chemically computed for a number of PAH molecules closely explains the UV bump of JADES-GS-z6-0, although the UV bump alone does not allow one to uniquely identify individual molecules. We suggest that, in the early Universe, PAH molecules originated from the physical and chemical processing of carbonaceous (e.g., graphite) grains in the ISM, which themselves originated from supernovae.
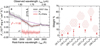 |
Fig. 5 Same as Fig. 3, but with all 48 PAH species included in fitting the rest-frame UV spectrum of JADES-GS-z6 measured by JWST/NIRSpec. |
Acknowledgements
We thank B.T. Draine, Q. Li, C.E. Mentzer, Q. Wang, and B. Yang for stimulating discussions and the anonymous referee for helpful comments and suggestions. Q.L. and X.J.Y. are supported in part by NSFC 12333005 and 12122302 and CMS-CSST-2021-A09. J.W. gratefully acknowledges support from the Cosmic Dawn Center through the DAWN Fellowship. The Cosmic Dawn Center (DAWN) is funded by the Danish National Research Foundation under grant No. 140.
References
- Allamandola, L. J., Tielens, A. G. G. M., & Barker, J. R. 1985, ApJ, 290, L25 [Google Scholar]
- Bohlin, R. C., Savage, B. D., & Drake, J. F. 1978, ApJ, 224, 132 [Google Scholar]
- Burkhardt, A. M., Lee, K. L. K., Changala, P. B., et al. 2021, ApJ, 913, L18 [Google Scholar]
- Cernicharo, J., Agúndez, M., Cabezas, C., et al. 2021, A&A, 649, L15 [EDP Sciences] [Google Scholar]
- Clayton, G. C., Gordon, K. D., Salama, F., et al. 2003, ApJ, 592, 947 [NASA ADS] [CrossRef] [Google Scholar]
- Draine, B. T. 1994, ASP Conf. Ser., 58, 227 [NASA ADS] [Google Scholar]
- Draine, B. T. 2003, ARA&A, 41, 214 [Google Scholar]
- Frisch, M. J., Trucks, G. W., Schlegel, H. B., et al 2016, Gaussian, Inc. 16, Revision C.01 (Wallingford CT: Gaussian, Inc.) [Google Scholar]
- Gredel, R., Carpentier, Y., Rouillé, G., et al. 2011, A&A, 530, A26 [CrossRef] [EDP Sciences] [Google Scholar]
- Henning, Th., & Schnaiter, M. 1998, Earth Moon Planets, 80, 179 [NASA ADS] [CrossRef] [Google Scholar]
- Iida, S., Hu, W., Zhang, R., et al. 2022, MNRAS, 514, 844 [NASA ADS] [CrossRef] [Google Scholar]
- Jäger, C., Mutschke, H., Henning, Th., & Huisken, F. 2008, ApJ, 689, 249 [CrossRef] [Google Scholar]
- Joblin, C., Léger, A., & Martin, P. 1992, ApJ, 393, L79 [NASA ADS] [CrossRef] [Google Scholar]
- Jones, R. O., & Gunnarsson, O. 1989, RvMP, 61, 689 [NASA ADS] [Google Scholar]
- Léger, A., & Puget, J. 1984, A&A, 137, L5 [Google Scholar]
- Léger, A., Boissel, & d’Hendecourt, L. B. 1988, Phys. Rev. Lett., 60, 921 [Google Scholar]
- Li, A. 2020, Nat. Astron., 4, 339 [CrossRef] [Google Scholar]
- Li, A., & Draine, B. T. 2001, ApJ, 554, 778 [Google Scholar]
- Li, Q., Yang, X. J., & Li, A. 2024, MNRAS, 535, L58 [NASA ADS] [CrossRef] [Google Scholar]
- Lin, Q., Yang, X. J., & Li, A. 2023, MNRAS, 525, 2380 [NASA ADS] [CrossRef] [Google Scholar]
- Malloci, G., Mulas, G., & Joblin, C. 2004, A&A, 426, 105 [CrossRef] [EDP Sciences] [Google Scholar]
- Marques, M. A. L., Castro, A., Bertsch, G. F., et al. 2003, Comp. Phys. Commun., 151, 60 [CrossRef] [Google Scholar]
- Marques, M. A. L., & Gross, E. K. U. 2004, ARPC, 55, 427 [NASA ADS] [Google Scholar]
- McGuire, B. A., Burkhardt, A. M., Kalenskii, S., et al. 2018, Science, 359, 202 [Google Scholar]
- McGuire, B. A., Loomis, R. A., Burkhardt, A. M., et al. 2021, Science, 371, 1265 [Google Scholar]
- Salama, F., Galazutdinov, G. A., Krelowski, J., et al. 2011, ApJ, 728, 154 [NASA ADS] [CrossRef] [Google Scholar]
- Schnaiter, M., Mutschke, H., Dorschner, J., Henning, Th., & Salama, F. 1998, ApJ, 498, 486 [NASA ADS] [CrossRef] [Google Scholar]
- Shivaei, I., Boogaard, L., Díaz-Santos, T., et al. 2022, MNRAS, 514, 1886 [NASA ADS] [CrossRef] [Google Scholar]
- Sita, M. L., Changala, P. B., Xue, C., et al. 2022, ApJ, 938, L12 [NASA ADS] [CrossRef] [Google Scholar]
- Spilker, J. S., Phadke, K. A., Aravena, M., et al. 2023, Nature, 618, 708 [NASA ADS] [CrossRef] [Google Scholar]
- Stecher, T. P. 1965, ApJ, 142, 1683 [NASA ADS] [CrossRef] [Google Scholar]
- Stecher, T. P., & Donn, B. 1965, ApJ, 142, 1681 [NASA ADS] [CrossRef] [Google Scholar]
- Steglich, M., Jäger, C., Rouillé, G., et al. 2010, ApJ, 712, L16 [NASA ADS] [CrossRef] [Google Scholar]
- Steglich, M., Carpentier, Y., Jäger, C., et al. 2012, A&A, 540, A110 [NASA ADS] [CrossRef] [EDP Sciences] [Google Scholar]
- Stockett, M. H., Bull, J. N., Cederquist, H., et al. 2023, Nat. Commun., 14, 395 [CrossRef] [Google Scholar]
- Tielens, A. G. G. M. 2008, ARA&A, 46, 289 [NASA ADS] [CrossRef] [Google Scholar]
- Valencic, L. A., Clayton, G. C., & Gordon, K. D. 2004, ApJ, 616, 912 [NASA ADS] [CrossRef] [Google Scholar]
- Wang, Q., Yang, X. J., & Li, A. 2023, MNRAS, 525, 983 [Google Scholar]
- Wenzel, G., Cooke, I. R., Changala, P. B., et al. 2024a, Science, 386, 810 [NASA ADS] [CrossRef] [Google Scholar]
- Wenzel, G., Speak, T. H., Changala, P. B., et al. 2024b, Nat. Astron., in press, [arXiv:2410.00670] [Google Scholar]
- Witstok, J., Shivaei, I., Smit, R., et al. 2023, Nature, 621, 267 [CrossRef] [Google Scholar]
- Yang, X. J., & Li, A. 2023, Nature, 621, 260 [NASA ADS] [CrossRef] [Google Scholar]
Strictly speaking, small, nano-sized graphite grains with a very definite graphite structure do not exist; instead, carbon nanoparticles may contain very small crystalline, turbostratic graphitic basic structural units (see Jäger et al. 2008). The UV absorption spectra measured for such nano-sized carbon grains do exhibit a prominent bump that closely resembles the 2175 Å extinction bump (Schnaiter et al. 1998).
The accuracy of the TD-DFT method has been verified by the experimental, gas-phase spectrum of anthracene (C14H10 ; see Malloci et al. 2004). However, it is not clear how accurate this method is for large molecules. We urgently need gas-phase experimental UV/visible spectra of PAH molecules of different species and sizes.
This is consistent with the comparison in terms of ΔA2175/NH, where ΔA2175 is the excess extinction at 2175 Å: with ΔA2175 ≈ 0.43 ± 0.07 mag (Witstok et al. 2023) and NH ≈ 4.3 × 1021 cm−2 as estimated above, we derive ΔA2175/NH ≈ 1.0 × 10⁻²² mag cm2 for JADES-GS-z6-0, about six times lower than the Galactic value of ΔA2175 /NH ≈ 5.8 × 10⁻²² mag cm2 (Draine 1994).
All Figures
|
Fig. 1 Target PAH molecules for TD-DFT computations of their electronic transitions. |
| In the text | |
|
Fig. 2 Peak wavelengths and widths of π* ← π transitions of individual PAH species. Also shown are those of the Galactic average (horizontal, dashed black lines) and JADES-GS-z6-0 observed by JWST/NIRSpec (horizontal, dashed red lines). |
| In the text | |
|
Fig. 3 Left panel a: fitting the rest-frame UV spectrum of JADES-GS-z6 measured by JWST/NIRSpec (solid gray-shaded line) with a power-law continuum (solid blue line) attenuated mainly by the absorption of PAH molecules (solid red line). The bottom orange-shaded line illustrates the fitting residual. Right panel b: the fractional weights of the molecules that best fit the JWST/NIRSpec spectrum of JADES-GS-z6. |
| In the text | |
|
Fig. 4 Upper panels a, e: same as Fig. 3 but with C64H20 excluded and C52H18 added. Middle panels b, f: same as Fig. 3 but with C57 H19 excluded. Middle panels c, g: same as Fig. 3 but with C52 H18 and C59H19 excluded. Bottom panels d, h: same as Fig. 3 but with all those seven best-fitting molecules excluded. |
| In the text | |
|
Fig. 5 Same as Fig. 3, but with all 48 PAH species included in fitting the rest-frame UV spectrum of JADES-GS-z6 measured by JWST/NIRSpec. |
| In the text | |
Current usage metrics show cumulative count of Article Views (full-text article views including HTML views, PDF and ePub downloads, according to the available data) and Abstracts Views on Vision4Press platform.
Data correspond to usage on the plateform after 2015. The current usage metrics is available 48-96 hours after online publication and is updated daily on week days.
Initial download of the metrics may take a while.