Fig. 3
Download original image
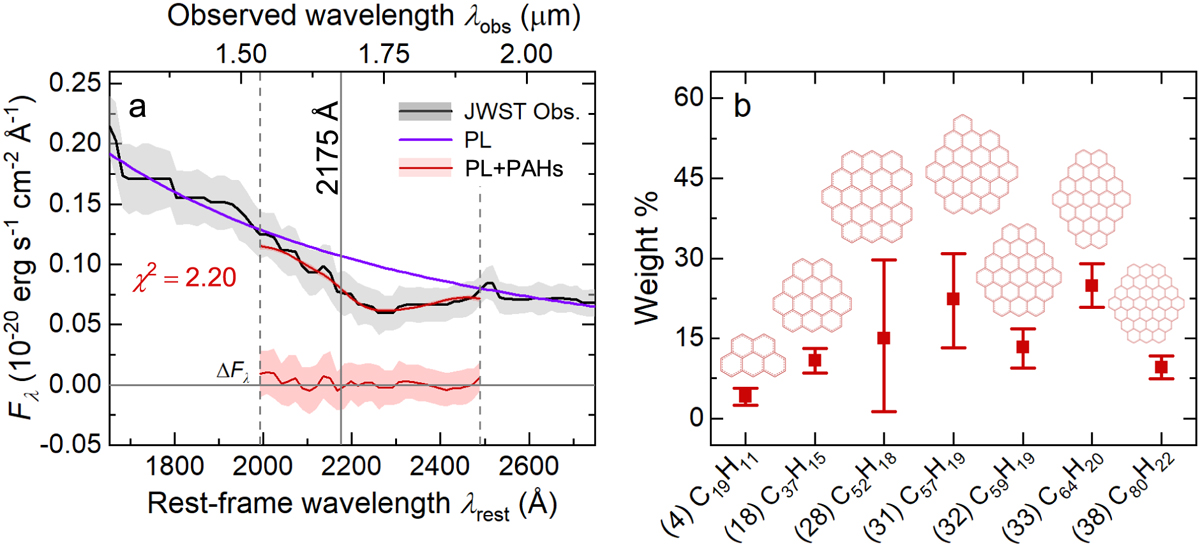
Left panel a: fitting the rest-frame UV spectrum of JADES-GS-z6 measured by JWST/NIRSpec (solid gray-shaded line) with a power-law continuum (solid blue line) attenuated mainly by the absorption of PAH molecules (solid red line). The bottom orange-shaded line illustrates the fitting residual. Right panel b: the fractional weights of the molecules that best fit the JWST/NIRSpec spectrum of JADES-GS-z6.
Current usage metrics show cumulative count of Article Views (full-text article views including HTML views, PDF and ePub downloads, according to the available data) and Abstracts Views on Vision4Press platform.
Data correspond to usage on the plateform after 2015. The current usage metrics is available 48-96 hours after online publication and is updated daily on week days.
Initial download of the metrics may take a while.