Open Access
Fig. 4
Download original image
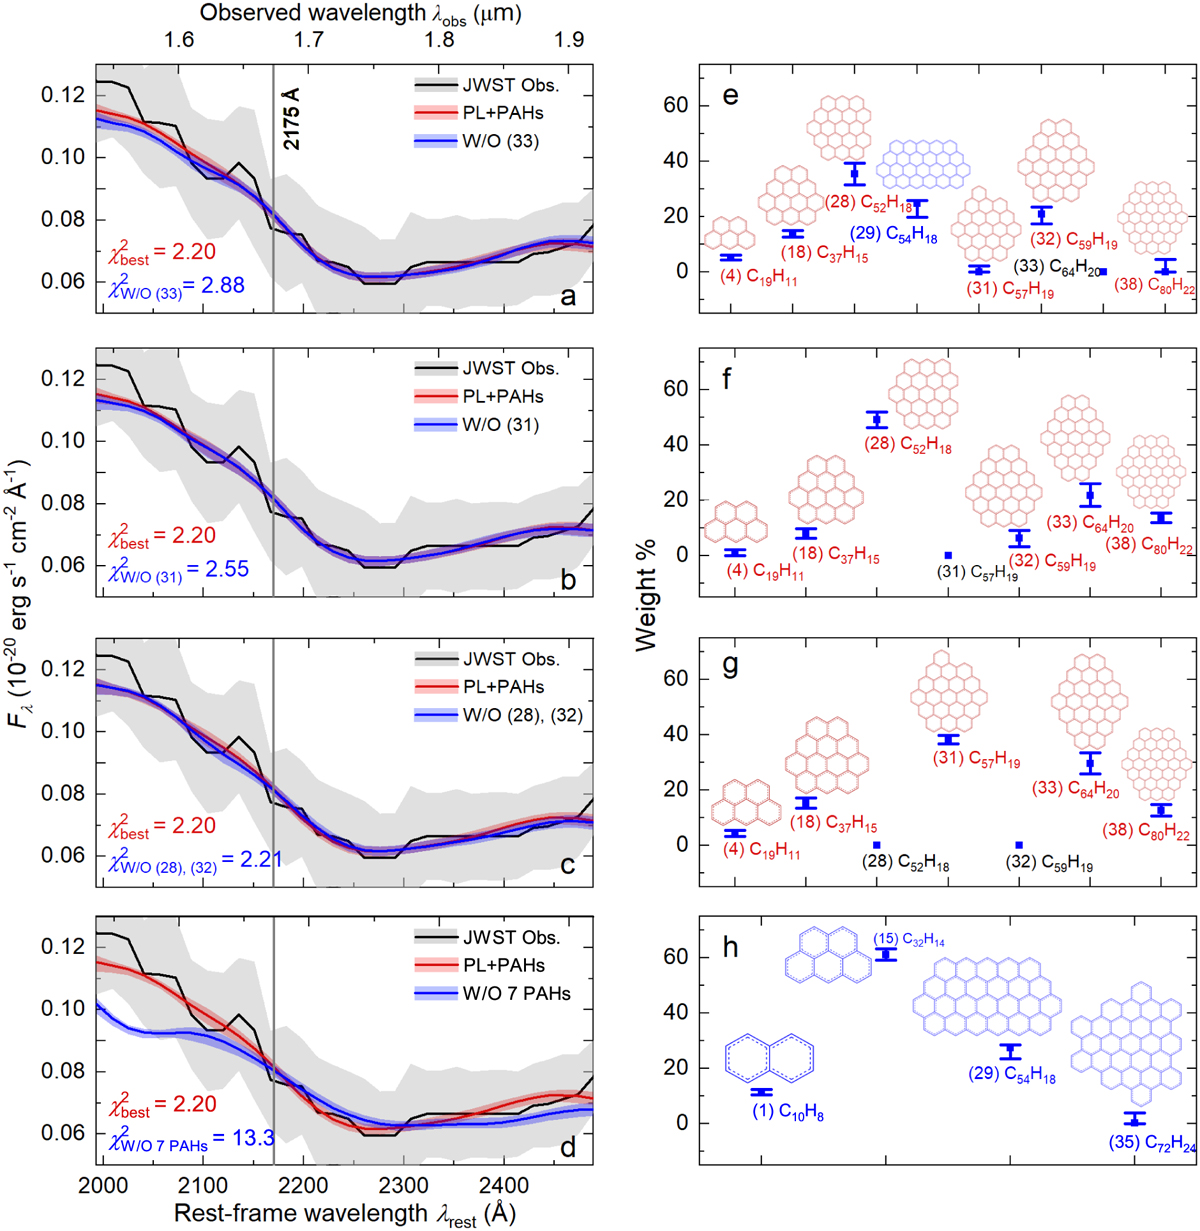
Upper panels a, e: same as Fig. 3 but with C64H20 excluded and C52H18 added. Middle panels b, f: same as Fig. 3 but with C57 H19 excluded. Middle panels c, g: same as Fig. 3 but with C52 H18 and C59H19 excluded. Bottom panels d, h: same as Fig. 3 but with all those seven best-fitting molecules excluded.
Current usage metrics show cumulative count of Article Views (full-text article views including HTML views, PDF and ePub downloads, according to the available data) and Abstracts Views on Vision4Press platform.
Data correspond to usage on the plateform after 2015. The current usage metrics is available 48-96 hours after online publication and is updated daily on week days.
Initial download of the metrics may take a while.