| Issue |
A&A
Volume 694, February 2025
|
|
|---|---|---|
| Article Number | A257 | |
| Number of page(s) | 18 | |
| Section | Interstellar and circumstellar matter | |
| DOI | https://doi.org/10.1051/0004-6361/202451818 | |
| Published online | 18 February 2025 | |
Observations of UX Ori in deep minima with the Nordic Optical Telescope
I. Analysis of spectral lines
1
Pulkovo Astronomical Observatory, Russian Academy of Sciences,
Pulkovskoe sh. 65,
St. Petersburg
196140,
Russia
2
Nordic Optical Telescope,
Rambla José Ana Fernández Pérez 7,
38711
Breña Baja,
Spain
3
Department of Physics and Astronomy, Aarhus University,
Munkegade 120,
8000
Aarhus C,
Denmark
4
Luleå University of Technology,
971 87
Luleå,
Sweden
5
SAAF, Svensk AmatörAstronomisk Förening,
Sweden
★ Corresponding author; lvtamb@mail.ru
Received:
6
August
2024
Accepted:
2
January
2025
Context. UX Orionis stars are the most active young stars; they undergo sporadic fadings of 2–4 magnitudes in the V-band, due to variable circumstellar extinction caused by a nearly edge-on star–disc system. The long-lasting monitoring of a number of stars of this type with the Nordic Optical Telescope from 2019 to 2024 has given a rich collection of material of high-resolution (R ∼ 25 000) spectra obtained during different brightness states of the stars. In this paper, we present the results of observations for UX Ori itself. Until now only one spectrum of high resolution had been obtained for this star during brightness minimum, making it difficult to do a comprehensive analysis.
Aims. Our aim is to analyse how different spectral lines change during such irregular fading events, when the star is going in and out of eclipses, obscured by dust along the line of sight.
Methods. For this purpose we provide a comparative analysis of the profiles and equivalent widths of the spectral lines belonging to the different atoms and ions. In addition we compare the results for UX Ori with those made for another target in our sample: RR Tau.
Results. Common features of variability are revealed: (1) a strengthening of the Hα line relatively to the continuum during eclipses; (2) the appearance of additional emission on the frequencies of photospheric lines (e.g. FeII, CaII, SiII). The different behaviour of the spectral lines during fading found for UX Ori and RR Tau may be caused by two effects: a different contribution of the scattered light to the stellar flux during eclipses or a less intense disc wind of UX Ori.
Key words: accretion, accretion disks / techniques: spectroscopic / stars: individual: UX Ori / stars: individual: RR Tau / stars: variables: T Tauri, Herbig Ae/Be / stars: winds, outflows
© The Authors 2025
 Open Access article, published by EDP Sciences, under the terms of the Creative Commons Attribution License (https://creativecommons.org/licenses/by/4.0), which permits unrestricted use, distribution, and reproduction in any medium, provided the original work is properly cited.
This article is published in open access under the Subscribe to Open model. Subscribe to A&A to support open access publication.
1 Introduction
UX Orionis stars (UXORs) are among the most active young stars. This is demonstrated by irregular flux variability, which takes the form of sporadic brightness weakening with amplitudes from 2 to 4 magnitudes in the V-band. The UXOR family includes both low-mass T Tauri stars (TTSs) and intermediatemass Herbig Ae stars (HAEs). The latter makes up the majority of this family. The typical duration of these brightness minima ranges from a few days to a few weeks for stars of spectral type A–F (see e.g. Mel’nikov 2001; Shakhovskoi et al. 2003, and references therein). Cooler TTSs often exhibit small-amplitude brightness minima (dippers) with duration of 1–2 days (see e.g. Ansdell et al. 2016; Roggero et al. 2021, and references therein). Occasionally, very long-lasting minima (more than a year) are observed (see e.g. Rostopchina-Shakhovskaja et al. 2012). This photometric behaviour is due to variable circumstellar (CS) extinction caused by dust from their protoplanetary discs, which in these stars make a small angle with the line of sight (LOS). In other words, an observer sees these star–disc systems nearly edge-on. This conclusion has been reached based (1) on observations of linear polarisation of UXORs (Grinin et al. 1991) and their modelling (Natta & Whitney 2000; Shulman & Grinin 2019), (2) on the behaviour of the shape of the Hα line profiles with the level of photometric activity (Grinin & Rostopchina 1996; Vioque et al. 2018), and (3) on the modelling of hydrogen lines (Tambovtseva et al. 2020). Modern interferometric observations have confirmed this conclusion (Kreplin et al. 2013, 2016, and references therein).
Nevertheless, while the physical explanation of the flux fading is found to be dust fragments passing in front of the star and eclipsing it, the cause of these sporadic appearances of dust clouds is less well established. One suggestion is that the disc wind or the poloidal component of the magnetic field is lifting up material from the disc atmosphere. In order to investigate how disc winds, dust clouds, and sub-structure in the inner regions of protoplanetary discs are connected, we have monitored with high-resolution spectroscopy several UXOR stars. Dramatic changes in the emission lines during the flux variation was shown by Rodgers et al. (2002) for the UXOR star RR Tau, and hybrid models treating both accretion and magneto-centrifugal disc winds have been proposed to explain them (Tambovtseva et al. 2020). Thus, monitoring the spectral behaviour of such stars during the dust eclipses is a way to investigate the processes at play. In addition, since the dust eclipses behave as a coronagraph, these observations offer a view into the inner regions of young protoplanetary systems that cannot be resolved spatially.
Echelle spectra of high resolution (R ∼ 25 000 Å) were obtained with the Nordic Optical Telescope (NOT) of several UXORs over the period 2019–2024, covering different brightness states of several UXORs, including deep minima. These observations were possible thanks to the flexible Target-of- Opportunity mode offered by the NOT and to knowing when to trigger based on photometric monitoring from our network of amateur astronomers. The first results, the spectra of the UXOR star RR Tau, were analysed and presented together with the modelling of its dust eclipses in Grinin et al. (2023).
In the present paper (Part I), we give a detailed analysis of the behaviour of the main spectral lines of UX Ori, the star that gives its name to this whole group of young stars. It should be mentioned that until now only one spectrum in the Hα region has been observed at high spectral resolution when UX Ori was in the brightness minimum (Grinin et al. 1994). All other spectral observations of this star were made in its bright state. Therefore, the spectra obtained in the present project with the NOT are unique because they were obtained in different states of brightness including the weakest ones. This permitted us for the first time to compare the behaviour of the lines of different atoms at the different ionisation stages. For such an analysis we selected the lines that belong to both neutral and ionised atoms. In addition, we selected the most interesting moments when the lines demonstrate dramatic or unexpected profile changes and considered them separately.
In addition to the study of the main spectral lines we aimed to investigate the reaction of the diffuse interstellar band (DIB) 6283 Å during brightness minima. Rodgers et al. (2002) reported changes in the DIB in RR Tau spectra during eclipses. Thus, a suspicion arose that the DIB can absorb the radiation of the star in the CS envelope. However, the spectra were not of high quality. Therefore, it was important to understand whether the DIB is strengthened during eclipses, and for this purpose UXORs are suitable because they are expected to display strong changes with the eclipse amplitude.
We compared the results of these observations with those obtained for RR Tau. In Sect. 2, we describe the observations and the data reduction. In Sect. 3 we present the spectra during the bright and faint phases, various special features are described in Sect. 4, and a comparison of spectral behaviour during eclipses between UX Ori and RR Tau is shown in Sect. 5. In Sect. 6, we discuss the implications and possible interpretations of the results. Modelling of the line profiles and eclipses for UX Ori will be presented in the next paper of the series (Part II).
2 Observations
The observations were obtained with the high-resolution FIber- fed Echelle Spectrograph (FIES) through its low-resolution fibre (Telting et al. 2014) at the Nordic Optical Telescope (Djupvik & Andersen 2010) over a period from 2019 February to 2024 March. Most of the data was obtained through observing programmes at the Nordic Optical Telescope (NOT) that were awarded Target-of-Opportunity time, a scheduling flexibility needed in order to catch the unpredictable variability of UXOR stars during their irregular fading events. Another necessary requirement was the frequent photometric monitoring and rapid communication of alerts when a fading was about to occur for one of our target stars. This was provided by the Swedish Amateur Astronomy Association (SAAF)1. The collaboration with SAAF and the observing strategy is described more in detail in Grinin et al. (2023).
FIES can be used with different fibres to obtain different spectral resolutions up to R ∼ 67 000, but we selected the low- resolution fibre, giving a resolving power of R ∼ 25 000 in order to obtain a reasonable S/N even when the targets went into fading. For UX Ori a nominal exposure time of 1800 seconds was used initially and until re-coating of the spectrograph mirrors took place in 2021 July, after which the typical exposure time was lowered to 1200 s due to an increase in the spectrograph throughput. The wavelength coverage is around 3700–9100 Å. Data reduction was made with the pipeline FIEStool2 (Stempels & Telting 2017). We used the tool molecfit (Smette et al. 2015) in its version 1.5.9 to correct the spectra for telluric contamination from the molecules H2O, O3, and O2. All the 1D spectra were normalised and put on a heliocentric velocity grid for further measurements and analysis using standard tasks in the IRAF package.
An overview of the observations is given in Table A.1 together with the quasi-simultaneous brightness obtained by photometry supplied from various sources: (1) The SAAF V-band, (2) NOT/ALFOSC or NOT/StanCam V-band, (3) AAVSO3 V-band, (4) ASASSN4 g-band, or (5) AAVSO Visual magnitudes, where the latter two were used when no proper V-band magnitude was available within 1 day of the FIES spectrum. Figure 1 shows the all collected V-band monitoring by SAAF, with the 54 epochs of FIES spectra marked in blue. For spectra where quasi-simultaneous SAAF or NOT V-band photometry was not obtained, we searched the AAVSO database for the nearest (in time) photometric point in either of the bands V, g, or Visual (see Table A.1).
3 Spectra in the bright and faint states of the star
The young star UX Ori is a Herbig Ae star of spectral type A3III. We took into account the investigation by the Crimean group accumulated in the paper by Rostopchina (1999), who determined the fundamental parameters of 11 UXOR stars (luminosities, masses, radii and ages) on the basis of long-term photometric monitoring, argueing that they are young stars, as well as the corrected parameters of UX Ori from the latest GAIA data (Guzmán-Díaz et al. 2021). We adopt the following stellar parameters: M∗ = 2M⊙, R∗ = 1.9 R⊙, Teff = 8500 K, and log 𝑔 = 4. The rotational velocity υ sin i = 140 km s−1, the radial velocity RV = +18 km s−1 (Grinin et al. 2001).
In this section, we present and analyse the line profiles of the hydrogen (Hα, Hβ), helium (HeI 5876 Å), sodium (NaI D 5889 Å (D1), 5895 Å (D2)), calcium (CaII 8542 Å) and iron (FeII 4925 Å) lines at different brightness states of the star over the long-lasting observational period from 2019 to 2024. When the star was in its normal (bright) state in 2019 is shown in Fig. 2. As the star was entering a short brightness minimum in the beginning of December 2020 and (possibly) going out of it is shown in Fig. A.1. The brightness minimum in January 2021 is shown in Fig. A.2. The last season of our observations (2023–2024) is presented in the following two figures. Fig. A.3 shows the beginning of the minimum in November-December 2023, and Fig. A.4 presents the brightness minimum in January 2024. The line profiles are given in the star coordinate system.
The most prominent hydrogen lines Hα and Hβ are the most informative lines regarding conditions in the close vicinity of the young star. In the normal (bright) state, the Hα line has a double-peaked profile with a typical ratio V/R > 1 (Grinin et al. 2001, and these observations). Earlier only once has a singlepeaked Hα emission profile been obtained during the deep and long-lasting brightness minima (Grinin et al. 1994). Our current observations demonstrate a single-peaked profile during the eclipse in January 2021 (Fig. A.2) and the long-lasting (a month or more) eclipse in January 2024 (Fig. A.4). These observations suggest that the single-peaked and almost symmetric Hα profile is a typical shape during the deep brightness minima.
In the normal state, the Hβ line profile shows a red-shifted absorption component; this profile becomes wider and shallower during the brightness minima, an indication of accretion of the material (see e.g. Figs. A.2 and A.4).
The HeI 5876 Å line does not disappear in the brightness minima as observed in the case of the RR Tau eclipses. The behaviour of the sodium lines also does not correlate with the brightness.
In Figs. 2, A.1–A.4, the calcium lines CaII 8542 Å and iron FeII 4924 Å (one line of the multiplet) are also shown. These lines are mainly photospheric, but they are interesting because they also contain a circumstellar line which can be both in absorption and in emission (so-called CS veiling). An analysis of the modification of these profiles is helpful to understand the physical processes in the nearest vicinity of the star. As is seen from Fig. 2, in the normal state, the lines of ionised calcium are of the inverse P Cygni type, which is typical for accreting matter. In the faint state on the other hand Figs. A.2–A.4 show that an additional emission appears and the absorption may partially or completely disappear. Sometimes an additional absorption appears on the red side (see Figs. A.1, and A.2). In the latter case, it is not connected with changes in brightness5. The FeII line behaves in a similar way as the CaII line: when the star is at maximum brightness it is in absorption and red-shifted, and during the minima an emission component is added, and the line becomes wider and shallower (see e.g. Fig. A.3 for the date Nov 30, 2023). We can suggest the following explanation for the changes observed in these line profiles during eclipses. When the star enters minimum, the emission begins to reveal itself on the background of the decreasing continuum. This emission is always present and it forms in a region which is not obscured by the screen. In the case of RR Tau we estimated the velocity of the blue-shifted emission in the photospheric lines (e.g. FeII) and suggested that it is due to the disc wind on the periphery of the disc (Grinin et al. 2023). The same may be suggested for UX Ori but keeping in mind changes in the line profiles, the scale of the lines variation is different and not as significant as in the case of RR Tau.
From the Hα emission lines obtained in the bright state of the star one can estimate a gas velocity of about 400 km s−1 ; the helium and sodium lines indicate gas velocities ∼200 km s−1 (see Fig. 2).
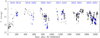 |
Fig. 1 V-band observations of UX Ori (black small circles) obtained mainly from observers (e.g. SAAF) and with a few additional data points from the NOT, are shown together with the epochs of FIES spectroscopy (large blue circles). When quasi-simultaneous SAAF or NOT V-band is lacking (empty blue circles), the nearest photometric point found by searching the AAVSO database is shown in Table A.1. |
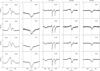 |
Fig. 2 UX Ori line profiles of Hα, Hβ, NaI D, CaII 8542 Å, and FeII 4924 Å during normal bright states in 2019. The line profiles are shown with respect to the stellar radial velocity (vertical line). The dates of the observations are shown in each plot. The left panel includes the values of the V-magnitudes, which are related to all the lines. The narrow emission components in the sodium lines are telluric lines (see text for details). |
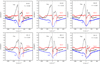 |
Fig. 3 The line profiles of Hα (black), Hβ (blue), and HeI + NaI D (red) in 2019 (upper panel) and in 2021 (lower panel). The central dip in Hα is located at about 10 km s−1 in 2019, and it is red-shifted to about 50 km s−1 in 2021. The dates and V-band magnitudes are given in each panel. |
4 Special features of the spectra
4.1 Deviation of the central dip in different epochs
In December of 2021, we observed that the symmetry of the Hα line profile is broken during the whole observational period, see Fig. 3. Although the profile remains double-peaked, the central velocity minimum (dip) is shifted by about 40 km s−1 to the red side, and the “red” emission component is noticeably narrower. To illustrate this, we have selectively overplotted the Hα, Hβ and NaI D1 line profiles obtained on the same dates for the two periods in 2019 and 2021. All of these spectra were obtained during the bright state of the star. In December 2021 the Hβ line has an additional absorption that appears in the red-shifted absorption profile, and the central dip of the Hα line coincides in velocity with the absorption component of the sodium line. The sodium doublet forms partially in the circumstellar medium, in the accretion zone, and partially in the interstellar medium. The Hβ line forms in a region that is a few times closer to the star than the Hα formation region (Grinin & Tambovtseva 2011; Tambovtseva et al. 2020).
The behaviour of the line profiles shown in Fig. 3 can be interpreted to suggest that in December 2021 we have caught the star in a moment of substantial infall of matter, in other words, an increase in the mass accretion rate. This explanation is acceptable if we take into account that instability of the line profiles may be a reaction to the changes in the accretion rate. This also leads us to suggest that for UX Ori, the disc wind does not have enough power to mask the signature of an accretion burst in the Hα line, like it does, for example, in the star RR Tau, another member of the UXOR family (Grinin et al. 2023). We also note that during the following dates, beginning of January 2022, the central dip has returned to its usual place, suggesting the mass accretion rate returned to its former value.
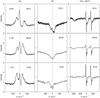 |
Fig. 4 Line profiles of Hα (left), Hβ (middle), and HeI 5876 Å + NaI 5889/5895 Å (right) in 2020. The dates of the observations are shown in each plot, and the left-hand panel includes the value of the V-band magnitude. |
4.2 Three-peaked Hα line profiles
On some dates we observed well-defined three-peaked Hα line profiles (Fig. 4). All the three emission peaks have deep gaps between them, and the two blue-shifted emission components are located at the same positions in all profiles, while the red-shifted component varies. This gives the impression that we observe this ‘three-peak event’ as mainly a transformation of the blue peak, forming an absorption dip in it, and thus being related to the matter moving towards the observer. We also note that in the Hβ line profile a small blue-shifted absorption is seen.
The spectrum in the upper panel was obtained when the star was in the normal bright state, while the two other were obtained on 9 and 12 March 2020, in the fainter state of the star. On March 12 the line HeI 5876 Å disappears, and the sodium lines become shallower. The latter could possibly be due to the presence of strong telluric emission lines compared to the weaker ones three days before, on March 9. We note that the narrow absorption components of the sodium lines are formed in the circumstellar and interstellar medium.
We suggest that such a configuration of the profiles may be a result of evolution of the blue peak due to non-stationary accretion (i.e. an absorption feature forming in the blue peak). It could also be explained by the appearance of emission arising on the periphery of the disc wind that is not obstructed by the dust screen.
The three-peaked Hα line profiles may be one of the manifestations of a non-stationary accretion. Examples of such profiles, but with red-shifted lines (in the Hα) and blue-shifted absorption components (in the Hβ line) are shown by Bouvier et al. (2007, their Figs. 9 and 10). The authors considered the young TTS star AA Tau which is seen nearly edge-on. Investigating the accretion/ejection processes of this star the authors concluded that the reason of such lines may be the time variability of the magnetospheric accretion flow on a timescale of a few rotational periods.
Another explanation is that a third emission peak is formed between the original blue and red peaks during obscuration of the star by the dusty screen, where the periphery of the disc wind remains visible beyond the screen. The Keplerian velocity of this gas is low, and therefore one can observe a narrow emission at the low velocities. In order to distinguish between the two possible explanations, it is required to sample with consecutive observations the entering into (or going out of) a fading event, where such a three-peaked profile appears.
4.3 Equivalent widths of HeI 5876 Å, NaI D1, D2, and OI 7774 Å
In this section, we investigate in more detail the correlation of the equivalent widths of such lines as HeI 5876 Å, NaI D26, and OI 7774 Å. Analysis of the behaviour of the HeI and OI lines is interesting because their formation requires high temperatures, because of the high excitation potential from the lower level, much larger than the temperature of the star or the disc wind. The latter may be about of 10 000 K for young stars (Safier 1993; Garcia et al. 2001). Such hot regions can appear near the star where accreting matter creates shocks when reaching the stellar surface. When estimating the equivalent widths (EWs), we took into account only the absorption part of these lines. We also did not remove their photospheric components because they are negligibly small (see Grinin et al. 2001, Fig. 1 therein).
Figure 5 demonstrates that the EWs of OI, HeI and NaI do not depend on the observed V-band magnitude. Nevertheless, the EWs of HeI and NaI D lines correlate with the EWs of oxygen OI (Fig. 6), and the correlation coefficients are 0.94 and 0.64, respectively. The correlation between the equivalent widths of sodium NaI (D2) and HeI is much weaker, it is 0.37. This implies that the changes in their line profiles are not caused by the eclipses of the star and its nearest vicinity. However, this contradicts the fact that many of the spectra are obtained during eclipses, i.e. when dust is screening the region of the line formation partially or fully. We suggest that the behaviour of these lines may be related to scattered light by the circumstellar dust. The contribution from scattered light to the stellar flux in the V-band is substantial, about of 10% of the radiation of the star in the bright state and almost 100% in the deepest minimum (Grinin 2000).
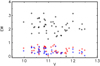 |
Fig. 5 Equivalent widths of OI 7774 Å (black), HeI 5876 Å (red), and NaI D2 (blue) vs. star brightness (V-band magnitudes) during different observational dates. |
5 Similarity and difference in the spectral lines of two stars of the UXOR family
In spite of the fact that UXOR stars belong to the same family due to their similar evolutionary status and the orientation of the star–disc system, there may be significant differences in the main stellar parameters and in the behaviour of their emission spectra, both in the normal state and during eclipses. We know from the theoretical study of young stars what physical processes take place in their environment and in which typical regions these various processes work (see e.g. Muzerolle et al. 2004; Kurosawa et al. 2006; Grinin & Tambovtseva 2011; Tambovtseva et al. 2014; Brittain et al. 2023). We can obtain important information from this region by monitoring the behaviour of main spectral lines in the normal bright state and the deep minima when the spectra are obtained with the same telescope/instrument setup. In this section we study how the spectra of UX Ori change during the fadings compared to those of RR Tau, analysed and presented in Grinin et al. (2023). The main stellar parameters of RR Tau (mass, radius, temperature and υ sin i) are very close to those of UX Ori. The spectral type of RR Tau is A0 III-IV, log 𝑔 = 3.5, RV = +11 km s−1 (Grinin et al. 2001). The contribution from the scattered light to the V-band flux is 3% in the bright state for this star (Grinin 2000), which is less than that from UX Ori, estimated to about 10%. We interpret this to indicate that the inclinations of the star-disc systems are slightly different for the two stars, since the disc properties are similar based on their infrared excesses (Grinin et al. 1991; Natta et al. 1997), and thus suggesting that the RR Tau disc is less tilted with respect to the LOS than that of UX Ori.
5.1 He 5876 Å, NaI D 5889/5895 Å, and OI 7774 Å
Let us compare the behaviour of UX Ori and RR Tau during bright and faint states by looking at the spectral region with the helium line HeI 5876 Å, the sodium NaI D 5889/5895 Å lines, and the OI 7774 Å line. Figure 7 shows UX Ori in the upper panels and RR Tau in the lower panels. We have selected two typical example spectra for both stars during bright states (blue) and during deep minima (red)7. In the case of UX Ori in the bright state, the neutral helium line is in absorption (panel a), like for RR Tau (panel c), while in the weak state, it does not disappear or enter in emission, as in the case of RR Tau (Grinin et al. 2023). In UX Ori only a slightly red-shifted and shallower line profile is seen, perhaps due to the appearance of some weak emission. It should be noted that we also observed a few cases when the HeI line disappears during the bright state of the star. Thus, we find that for UX Ori the disappearance of the HeI absorption line does not correlate with the star’s brightness, and may be instead related to a variable mass accretion rate. The same may be said about the changes in the neutral oxygen line (Fig. 7b,d).
As for the sodium lines, their qualitative behaviour in UX Ori and RR Tau spectra during bright and weak states are similar. Nevertheless, it has to be kept in mind that the doublet sodium lines originate in different parts of the stellar envelope: in the CS and interstellar (IS) medium unlike the HeI and OI lines.
As mentioned above, the behaviour of the HeI and NaI D line profiles in the spectra of UX Ori do not show an evident correlation with the star brightness in contrast to what occurs in the RR Tau spectra. There were only a few instances when the helium line disappeared and the sodium doublet merely consisted of the IS component (see e.g. Fig. A.1). In all those cases, the star was in its normal bright state, and this behaviour may be a consequence of decreasing temperature in the gas accreting on to the star. During brightness minimum, on the other hand, the HeI absorption line does not disappear, probably because the scattered light dominates, since its contribution is greater for UX Ori than for RR Tau, and scattered light does not make the absorption disappear. This explanation is not valid for RR Tau because the HeI and OI absorption lines disappear only during brightness minima when the magnetosphere is covered by the dust screen, and the contribution from the scattered light is too small to prevent it.
5.2 Forbidden oxygen lines [OI] 6300 Å
Figure 8 presents the forbidden lines of the neutral oxygen [OI] at 6300 Å in the normal and weak states of UX Ori (a) and RR Tau (b). For each star we chose dates of maximum and minimum brightness. For UX Ori we show the bright state in 2020 (V = 9.98 mag) and the minimum in 2021 (V = 12.48 mag). Correspondingly, for RR Tau these are in 2019 (V = 10.66 mag) and (V = 13.85 mag). In the normal state ofUX Ori this line reveals a weak emission but in the brightness minima an additional emission component appears with a peak ratio blue-to-red (V/R < 1). However, as an analysis of other line profiles during this minimum in Jan. 2021 and in Jan. 2024 shows that this peak becomes stronger, its radial velocity remains approximately constant on the different dates, ranging from −55 to −20 km s−1 in the stellar velocity system. The reason for these almost similar radial velocities is that all these observations were made in January, and in the Earth’s system all peaks were at the same velocity, pointing directly to the most likely interpretation that they originated in the Earth’s atmosphere.
We can conclude that during eclipses, the intensity of the [OI] 6300 Å line increases and its profiles are slightly blue-shifted relatively to zero velocity reaching ∼75 km s−1 in the wings. It is seen from Fig. 9 where we show [OI] 6300 Å line profiles in the deep minima of RR Tau (V = 13.85 mag on Mar. 3, 2019) and UX Ori (V = 12.48 mag on Jan. 18, 2021). One can see that in both stars the wings of the profiles reach the velocity of about ±75 km s−1.
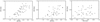 |
Fig. 6 Equivalent widths of HeI 5876 Å vs OI 7774 Å (left), NaI D2 vs OI 7774 Å (middle), and NaI D2 vs. HeI 5876 Å (right). The correlation coefficients are 0.94, 0.64, and 0.37, respectively. |
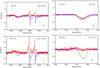 |
Fig. 7 Upper panel (a, b): HeI 5876Å + NaI D lines (left) and OI 7774Å (right) in the spectra of UX Ori in the normal state on Sep 5, 2020, V = 9.98 mag (blue) and brightness minimum on Jan. 18, 2021, V = 12.48 mag (red). Lower panel (c, d): The same as in the upper panel but for RR Tau: in the normal state with V = 10.66 mag on Oct. 5, 2019, and in the weak state with V = 13.85 mag on Mar. 15, 2019. |
5.3 FeII multiplet 4924/5018/5069 Å
The behaviour of the FeII multiplet in UX Ori shown in Figs. 10a and b are analogous to that of oxygen OI 7774 Å and helium HeI 5876 Å in Fig. 7. In the bright state of the star these lines exhibit red-shifted absorption profiles (a), and in the faint state a small emission appears at the blue side (b). In the spectra of RR Tau, these lines are red-shifted absorption lines in the bright state (see Fig. 10c) and blue-shifted emission lines in the faint state of the star. The wings of the FeII lines reach values of about 200 km s−1 in both stars.
5.4 SiII 6347/6371 Å
Investigation of the silicon lines in the spectra of young stars is especially interesting because silicon is a part of the circumstellar dust. Until the dust evaporates, silicon is hardly found in gas phase, and this usually takes place at the dust sublimation radius which is at a distance of 0.3–0.5 AU from the star (e.g. Tannirkulam et al. 2007; Flock et al. 2017). In such a case, one can detect a circumstellar ‘CS veiling’ in the spectra due to added CS emission. The classical veiling is not related to the emission in the CS envelope, but to processes on the star itself (e.g. an appearance of hot spots on the stellar surface).
In the case of the CS veiling, the line is seen not only in absorption, but also in emission. Therefore, it is interesting to monitor the behaviour of the SiII 6347/6371 Å lines during the bright and weak states, and in the latter case the abundance of gas phase silicon can lead to CS veiling.
Previous observations of UXORs with the NOT (Grinin et al. 2001), among them UX Ori and RR Tau, gave a rich material, but unfortunately the stars were in their bright states except for one observation of RR Tau. The SiII 6347/6371 Å changed insignificantly in comparison with other absorption lines. With the current data set we are in the position to study the SiII 6347/6371 Å line stability through fading events. We compare the line profiles of SiII 6347 Å (the strongest of the two) in the bright and weak states of the stars for UX Ori and RR Tau in Fig. 15. For reference, in each panel we overplot the profile of the same line obtained in the normal state of the star. For UX Ori we find the following effect: sometimes, in the brightness minima, the SiII line profile becomes deeper than that in the normal state. We did not find such an effect in other photospheric lines. Moreover, in the RR Tau spectra the silicon line goes in emission during eclipses. The quantity of this emission may vary, but we did not find any additional absorption as in the case of UX Ori. We suggest that this absorption is not related to mass accretion; but most likely due to gas located just on the outer boundary of the magnetosphere where the gas velocity is still low.
Figure A.5 shows other photospheric lines, such as MgI 5184 Å and FeII 5169 Å, of UX Ori during the same period, and for comparison again we add the line profile obtained in the bright state of the star. One can see from the figure that the MgI lines have a very similar shape both in the bright and faint states of the star, and we note that the FeII line is not deeper during the minima than in the bright state of the star.
Figure 11 presents the SiII 6347 Å line profiles averaged over five different dates during maxima (blue) and minima (red) of the stars for UX Ori (a) and RR Tau (b). It is seen that in the case of UX Ori, the average silicon line profiles during eclipses are similar to those during the normal state. Another picture is observed for RR Tau: in the brightness minima it looks like an inverse P Cygni line profile (red). During the minima, however, the star and its magnetosphere are eclipsed, thus, the blue-shifted emission must refer to a wind component.
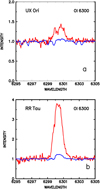 |
Fig. 8 Forbidden oxygen lines in the spectra of UX Ori and RR Tau. Upper panel (a): [OI] 6300 Å lines in the spectra of UX Ori in the normal state with V = 9.98 mag on Sep. 5, 2020 (blue) and brightness minimum with V = 12.48 mag on Jan. 18, 2021 (red). Lower panel (b): The same as in the upper panel but for RR Tau with V = 10.66 mag on Oct. 5, 2019 (blue) and with V = 13.85 mag on Mar. 15, 2019 (red). |
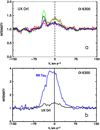 |
Fig. 9 Forbidden oxygen line [OI] 6300 Å during brightness minima. (a) [OI] 6300 Å profiles in the spectra of UX Ori during the minimum in 2021: Jan. 18, V = 12.48 mag (red); Jan. 20, V = 12.0 mag (blue); Jan. 24, V = 12.36 mag (green); Jan. 27, V = 12.27 mag (magenta), and Jan. 28, V = 12.37 mag (black). (b) Comparison of [OI] 6300 Å profiles in the brightness minimum of UX Ori (Jan 18, 2021, V = 12.48 mag, black) and RR Tau (Mar. 15, 2019, V = 13.85 mag, blue). |
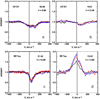 |
Fig. 10 Changes in the FeII multiplet in the bright state and during eclipses. Upper panel: UX Ori. The bright state (left), and the deep minimum (right). Lower panel: RR Tau. The bright state (left), and the deep minimum (right). Brightness in the visible is shown in each plot. The multiplet components are (in Å): 4924 (black), 5018 (red), and 5069 (blue). The dates of the bright and weak states of stars are the same as in Fig. 7. |
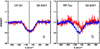 |
Fig. 11 SiII 6347 Å line profiles averaged over five observational dates in the brightness minima (red) and maxima (blue) for UX Ori (a) and RR Tau (b). |
5.5 Discrete narrow components
Further analysis of the UX Ori spectra reveal the appearance of discrete absorption components (DACs) in the sodium line profiles which are seen when the star is in its normal state. Figure 12 (upper panel) shows spectra obtained of UX Ori on two different dates: Jan 30, 2020 (V = 10.83 mag) and Sep. 12, 2022 (V = 10.50 mag). The spectra are presented in the coordinate system of the star.
The observed DACs are marked in the figure with numbered lines, and their corresponding velocities in km s−1 are shown in Table 1. Taking into account the uncertainty in the measurement of the DAC velocities due to the presence of the telluric lines and noise, we conclude that they are very similar in both components of the doublet D1 and D2 .
In the spectra of RR Tau, we also found such components in the NaI D lines for the two dates: Nov. 18, 2019 and Sep. 5, 2020 as shown in the lower panel of Fig. 12. At those dates the brightness of the star in the visible was 12.54 mag and 11.94 mag, respectively. We determined the velocities of the absorption components taking into account the radial velocity of RR Tau. We consider the discrete character of the red-shifted absorptions in the NaI D lines in Sect. 6.
6 Discussion
Long-term spectral monitoring of UXORs (2019–2024) comprising both dust eclipses of various degrees, as well as observations of the stars in their bright states, has given a rich observational material. In this section we discuss the analysis of several spectral lines of UX Ori, and we compare our conclusions for this star with those made for RR Tau, another star of the UXOR family (Grinin et al. 2023).
6.1 Hydrogen lines Hα and Hβ
The behaviour of the Hα emission line during the brightness minima of UX Ori is compatible with the model of eclipses where the dusty screen completely covers the star, but not completely the more extended line emission region, including part of the magnetosphere and the disc wind (Tambovtseva et al. 2020; Grinin et al. 2023). Most of the emission in this line forms in the disc wind, while the magnetosphere plays a smaller role. At the moment of eclipses the intensity of the line increases relatively to the decreasing continuum. As seen in Figs. A.2 and A.4 the line profile predominantly becomes almost single-peaked, though in some cases it retains a double-peak shape. A single-peaked profile as the one observed in Jan. 2024 and shown in Fig. A.4 was observed only once earlier (Grinin et al. 1994).
Unlike for Hα, the role of the disc wind is less important with regards to the formation of the Hβ emission line. The main contribution comes from the magnetosphere which is almost completely obscured by the dust screen during the minima. This is not surprising since the Hβ line forms in a region which is closer to the star compared to the Hα formation region (see e.g. Grinin & Tambovtseva 2011; Tambovtseva et al. 2020).
We estimated the equivalent widths of the Hα and Hβ lines after having removed the photospheric component by extracting the synthetic spectrum corrected for rotation. Figure 13 shows how the equivalent width of the Hα line (left panel) increases as the star becomes fainter. As mentioned above, this is due to the contrast between the emission line and the continuum. With the three vertical panels we distinguish between the EWs of (a) the total line, (b) the red part of the double-peaked profile belonging to the positive radial velocities, and (c) the blue part with negative radial velocities. It is seen that the EWs of both the red and the blue components of the Hα line profiles increase when the brightness decreases. Observations of the RR Tau spectra (Rodgers et al. 2002) lead to the same conclusion. The behaviour of Hβ, however, shown in the right hand panels, does not have the same trend. While the blue component clearly increases when the star fades, the red component is more scattered with no clear trend.
We compared the emission profiles of several Hα lines obtained in the normal state of the star and during the minima. For this we shifted the observed spectra to the star’s coordinate system in the region of the line and subtracted a synthetic spectrum. After this we reduced the chosen profiles to the same energetic units. In order to determine the reduction coefficient we calculated the radiation flux in the continuum Fi at the observational moment i as
 (1)
(1)
where ΔV= Vi − V0, and V0 is the star’s magnitude taken in the bright state. The value of V0 was chosen by averaging over the five magnitudes obtained in the bright states, getting a mean V0 = 10.43 mag. Then, the emission spectra of all chosen lines, including that taken in the bright state, were multiplied by the reduction coefficients defined from the above relation. The comparisons are shown in Fig. 14 in panels a and b. The same procedure was applied to spectra of RR Tau during bright and faint states (panels c and d).
We see that during eclipses the Hα line profiles become narrower than in the bright states. This takes place because during the brightness minima the dust screen covers the star and the region near the star where the Keplerian velocity is the highest. Depending on the position of the screen, we can see the line profiles either nearly symmetric around the central velocity or slightly asymmetric (Fig. 14b). Not only the position of the screen, but also the non-homogeneous structure of the emitting region may cause such an asymmetry.
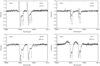 |
Fig. 12 Line profiles of the sodium doublet NaI D1 and D2 (5889/5895 Å) with DACs in the spectra of UX Ori in 2020 (left) and 2022 (right) (upper panel) and RR Tau in 2019 (left) and 2020 (right) (lower panel). Spectra are shown in the stars’ coordinate systems. See details in the text and in Table 1. |
Velocities of the discrete absorption components for UX Ori and RR Tau (in km s−1) in the coordinate system of the star.
6.2 Special features of the line profiles. Comparison with RR Tau
Comparative analysis of the spectral variability of UX Ori and RR Tau reveal the following differences: the Ha line in the spectra of UX Ori demonstrate a greater variety of profiles than RR Tau, including the above mentioned three-peaked profiles that never were observed in the spectra of RR Tau, but are episodically observed in the spectra of T Tauri stars (Bouvier et al. 2007). This suggests that the emission region of UX Ori may differ from that of RR Tau. Our analysis permits us to conclude that there is a different ratio between the power of the accretion and disc wind (i.e. the disc wind of UX Ori is weaker than that of RR Tau). This is consistent with the weaker mass accretion rate onto UX Ori compared to that onto RR Tau given by Guzmán-Díaz et al. (2021).
Let us compare the influence of the accretion process on the line profiles. The Ha profile is typical for the disc wind structure, but its asymmetry (the peak ratio V/R is always greater than one) is a sign of accretion (see e.g. Fig. 2). Such a profile may be obtained if the emission in the red component is reduced due to absorption by the accreting gas. The Hβ line profile supports this interpretation because its asymmetry remains in the inverse P Cygni shape. Natta et al. (2000) show spectra of UX Ori where the absorption features in the red wing of the Hα line correspond to the location of the absorption features in the sodium lines (see Fig. 2 in their paper). This fact was used by the authors as an argument for the presence of magnetospheric accretion. In the present observations the absorptions in the red components of the NaI D lines is also at about the same velocities as in the Hα lines (see Fig. 3).
When comparing changes in the different line profiles during the eclipses, we note several differences between UX Ori and RR Tau. For RR Tau the Hα line shape stays double-peaked during eclipses, while for UX Ori the profile may stay doublepeaked or become single-peaked. In the case of RR Tau the Hβ profile takes the shape of inverse P Cygni during bright states and the double-peaked emission profile with changing V/R ratios during eclipses. In UX Ori, on the other hand, we find that during brightness minima an absorption feature appears bluewards of the inverse P Cygni Hβ line shape. At the line centre of Hβ an additional emission feature may appear (see e.g. Fig. A.4).
In RR Tau the photospheric lines which are in absorption during the bright states transform into the emission lines during the minima, while in UX Ori only CaII 8642 Å enters in emission during the minima. Other lines either show presence of a weak emission (the FeII triplet) or practically do not change (e.g. SiII 6347, 6371 Å, and MgI 5184 Å).
We did not find a clear correlation between absorption on the red side of the NaI D profile and the star’s brightness. The reason may be related to the fact that these lines form in different regions, which makes the analysis difficult. The NaI D line partially forms in the accreting region and partially on the CS or IS periphery. The discrete character of the red-shifted absorptions in the NaI D lines in Fig. 12 testifies to the extremely irregular distribution of the accreting matter in the magnetosphere of UX Ori and to the non-stationary character of the accretion. We observed the DACs in both stars; their appearance may be explained by either a gas stream that accretes on to the star and circles the star several times with the different infall velocities, or a non-homogeneous gas (blob) which accretes directly onto the star.
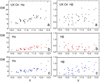 |
Fig. 13 Changes in the equivalent widths (EW) of Hα (left panel) and Hβ (right panel) as a function of the observed brightness of UX Ori given as V-band magnitudes. We distinguish between (a) the total EW of the profile, (b) the EW of the red part of the profile where velocities are positive, and (c) the EW of the blue part of the profile where the velocity is negative. |
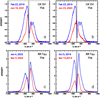 |
Fig. 14 Comparison of the Hα emission line profiles, scaled to the same energetic units in the bright and faint states. Upper panel: the Hα emission line profiles in the normal bright state (blue) at V = 10.55 mag and two different faint states (red) of UX Ori. The epochs of each profile are given in the plots. In the two faint states the photometric measurement are (a) V = 12.48 mag and (b) V = 11.70 mag. Lower panel: same as in the upper panel, but for bright and faint states of RR Tau observed in 2019 (c) and 2022 (d). The photometric measurement in the bright and faint states are V = 10.86 mag and V = 13.77 mag (c), and V = 10.66 mag and V = 13.85 mag (d); see text for details. |
6.3 Lines of the high-excitation HeI 5876 Å and OI 7774 Å
Very interesting differences are shown by the two absorption lines HeI 5876 Å and OI 7774 Å. Both of them originate in the hot gas of the stellar magnetosphere, because only there one can expect sufficiently high temperatures for the excitation of these lines.
These absorption lines disappear during the brightness minima of RR Tau due to filled in emission which is not seen in the normal bright state. In the spectra of UX Ori, on the other hand these absorption lines do not disappear, they become weaker but remain visible, as shown in Fig. 7. We propose that these differences are caused by the different level of scattered light from the protoplanetary disc. In the case of UX Ori the contribution from scattered light is noticeably higher than in the case of RR Tau. This follows from the differences in the photometric amplitudes at the minima, which are ∆V = 2–3 magnitudes for UX Ori and ∆V = 3–4 magnitudes for RR Tau. During eclipses the relative contribution from scattered light to the total brightness of the star increases, and the amount of scattered light sets a limit to how large the amplitude at minimum can be. In the bright state the scattered light contributes 10% of the observed radiation in the case of UX Ori, and only 3–4% of the observed radiation in the case of RR Tau.
From the analysis of the UX Ori spectral lines in the bright state (Hα, HeI 5876 Å, NaI D and OI 7774 Å) we conclude that the gas falls on to the star with a velocity of about 200 km s−1.
The outflow velocity is about of 400 km s−1. Approximately the same values are valid for RR Tau. A detailed comparative analysis of parameters and features of emitting regions of these stars will be given after modelling of the UX Ori hydrogen line profiles in Part II.
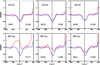 |
Fig. 15 Si II 6347 Å in the spectra of UX Ori in 2021 (upper panel) and RR Tau in 2022 (lower panel, left) and in 2021 (lower panel, middle and right) during the brightness minima (red). The dates of the observations and V-band magnitudes are shown in each plot. The blue lines represents the bright state reference SiII line profile. Shown are the observed profiles in the bright states on Feb. 20, 2019, with V = 10.59 mag for UX Ori, and on Jan. 7, 2022, with V = 10.58 mag for RR Tau. |
6.4 Photospheric lines
Investigation of photospheric lines (e.g. Fe, Si, Mg) plays an important role in our understanding of the physical and geometrical structure of the regions nearest to the star, and the processes taking place there, because they are not expected to be with CS absorption or emission lines. The photospheric lines are used when defining important parameters (e.g. the rotational velocity of the star, log 𝑔).
Nevertheless, we observe that photospheric lines show line profile changes during brightness minima due to the appearance of emission that is hard or impossible to see in the bright state. During brightness minima one can determine the possible place of the line formation and its intensity as we have done in the case of RR Tau (Grinin et al. 2023). In the spectra of RR Tau the appearance of the emission is clearly seen, while in UX Ori these line changes are less clear (see Figs. 10, 15, and A.5). For both stars we interpret the character and source of the additional emission to be that part of the disc wind which arises on the periphery of the CS disc and is not obscured during an eclipse. One can expect the appearance of CS veiling that is caused by processes occurring in the CS envelope.
It should be noted that the scattered radiation of the proto-planetary disc can broaden the photospheric lines of T Tauri stars but only weakly influence the photospheric lines of UXORs. Both UX Ori and RR Tau are rapidly rotating stars and for them broadening of these lines is negligible (Grinin et al. 2022). However, the radiation of the young stars may be scattered, not only in the dusty disc, but also in the magneto-centrifugal disc wind. The latter lifts small dust particles (Safier 1993). Therefore, the disc wind may be an additional source of scattered radiation. In this case, the photospheric lines are both broadened due to a differential rotation of the disc wind and possibly red-shifted (Grinin et al. 2006, 2012).
6.5 Forbidden oxygen line [OI] 6300 Å
We compared the behaviour of the forbidden oxygen lines in the RR Tau and UX Ori spectra in Fig. 9 and concluded that the changes in line profiles are identical, and differences are only in the scale of the processes. The line profiles have the following structure: they contain a low-intensity emission profile slightly blue-shifted relatively to zero velocity. The place of the formation of the low-intensity emission in UX Ori is identical to that in RR Tau: these are regions of low density where matter outflow exists but rotation is small. Such characteristics fit well with the region where the photoevaporative disc wind forms, in the periphery of the protoplanetary disc (see e.g. Ercolano & Owen 2010, 2016; McGinnis et al. 2018; Ballabio et al. 2020; Pascucci et al. 2023, and references therein). The line profiles are symmetric relatively to zero velocity, the wind velocity reaches ∼75 km s−1 that coincides with the velocity of the same line in the RR Tau spectra.
6.6 Summary data on the line formation regions and line properties for both stars
Having analysed the lines in the spectra of UX Ori and RR Tau, we have highlighted the main conclusions about their properties and regions of their formation as well as their similarity and difference.
The Hα line forms in the circumstellar (CS) region in the accretion and disc wind zones. In both stars the Hα line profiles demonstrate the double-peaked profile in the bright state with a deep gap at the velocity close to zero, with the blue-to-read peak ratio V/R > 1 (UX Ori) and V/R ≤ 1 (RR Tau). During eclipses the emission lines grow relatively to the decreasing continuum by a factor of 1.5–3 (UX Ori) and a factor of about 8 (RR Tau) compared to their bright state. During the brightness minima the UX Ori line profiles can keep their double-peaked shape, but more often they transform into a single-peaked profile, while for RR Tau the double-peaked line profiles are also retained during minima.
The Hβ line forms in the CS envelope (in accretion and disc wind zones) in a smaller area compared to that of the Hα line formation. In the bright state its line profiles are in absorption and a little red-shifted (UX Ori) and have an inverse P Cygni shape (RR Tau). In the brightness minima of UX Ori a weak emission is seen at the blue side: the line profiles become slightly wider and shallower. In the brightness minima of RR Tau the line profiles become intense and double-peaked with the wind features: V/R < 1.
The HeI 5876 Å and OI 7774 Å form in the accretion region of CS envelope of both stars. In the bright state their line profiles are in absorption. In the brightness minima of UX Ori they do not change. In the brightness minima of RR Tau the absorption disappears.
The sodium doublet NaI D lines originate in the accretion part of the CS region and partially in the interstellar medium. In both stars they are in absorption. In the brightness minima of RR Tau the emission can appear while in that of UX Ori the line profiles remain in absorption.
The lines of the CaII (8498/8542/8662 Å) and FeII (4924/5018/5069 Å) triplets and SiII (6347/6371 Å) doublet originate in the star and the accretion part of the CS envelope. In the bright state of both stars the CaII and FeII lines are in absorption and red-shifted, resembling the inverse P Cygni profile. In the brightness minima the wind emission is added from the blue side: the profiles remain in absorption (UX Ori) and transform into the emission ones (RR Tau). The SiII lines are in absorption in the bright state of both stars. They are almost symmetric relatively to the zero velocity (UX Ori) and they are red-shifted (RR Tau). In the brightness minima they did not change (UX Ori) and transforms to the profiles with the blue-side emission (RR Tau).
The forbidden oxygen [OI] (6300/6363 Å) lines have a single-peaked profile in the bright state for both stars, in the brightness minima the profiles keep their shape and their intensity increases weakly (UX Ori) and significantly (RR Tau). The luminosity of the lines remains constant during eclipses, this means that they are formed in a region beyond the dust screen. The line profiles are practically symmetric relative to zero velocity (UX Ori) and slightly blue-shifted (RR Tau). The source of their formation may be a photoevaporated disc wind on the periphery of the disc (both stars) or a weak jet manifesting itself only spectrally (RR Tau).
We can conclude more quantitatively about the regions of the hydrogen line formation and thus on the accretion and mass loss rate after modelling of the eclipses in UX Ori.
7 Conclusion
Spectral lines of young stars observed through the atmospheres of their protoplanetary discs, due to their specific orientation, give important information about the physical processes occurring in the vicinity of the star. We analysed the spectra of UX Ori obtained during the long-lasting (five years) period of monitoring and Target-of-Opportunity observations with the NOT, and compared them with those obtained for RR Tau with the same telescope in the same period. We have made the following conclusions:
During eclipses of the star by the gas and dust fragments acting as a screen, a strengthening of the Hα emission line relative to the decreasing continuum occurs. At the same time the line profile becomes narrower because the opaque screen covers the star, and also that part of the moving gas of the Hα emitting regions where the Keplerian velocity is the highest. During eclipses the Hα line profiles may be double-peaked or single-peaked;
During eclipses additional emission appears at the frequencies of the photospheric lines (FeII, CaII, SiII and others). This may lead to circumstellar veiling of these lines;
When determining fundamental parameters of UXORs (e.g. Teff, log g, v sin i) one has to use the spectra obtained in the bright state of the stars because in brightness minima the emission component of the disc wind lines that are not obscured by the dust screen is added to the photospheric lines. For the same reason, the radial velocity measurements of these stars may be red-shifted;
The two UXOR stars UX Ori and RR Tau display different behaviours in some of the spectral lines during the brightness minima. The reason for these differences may be either a different contribution of the scattered light component to the total stellar radiation during eclipses and/or a less intense disc wind in the case of UX Ori;
Our observations showed that in the spectra of UX Ori and of RR Tau the diffusion interstellar band (DIB) at 6283 Å did not change, even when the brightness decreased significantly. This means that the CS extinction does not add anything to the DIB and that the DIB has a purely interstellar origin.
Because of the specific orientation of the star–disc system of young stars of the UX Orionis family, observations of these stars permits us to study details in the spectra that cannot be seen in other young stars. In this paper we have presented long-term spectral monitoring of UX Ori, and we have compared the results to those of RR Tau. Further spectroscopic studies of this star type during their brightness minima will give information about the location and structure of the emitting regions near the young stars due to the enhanced contrast between the line emission and the star continuum provided by the eclipses.
Acknowledgements
We thank the referee for helpful comments and suggestions concerning this work. Based on observations made with the Nordic Optical Telescope, owned in collaboration by the University of Turku and Aarhus University, and operated jointly by Aarhus University, the University of Turku and the University of Oslo, representing Denmark, Finland and Norway, the University of Iceland and Stockholm University at the Observatorio del Roque de los Muchachos, La Palma, Spain, of the Instituto de Astrofisica de Canarias. AAD would like to thank all the students and staff at the NOT for all the work in making the flexible scheduling possible and efficient. A special thanks is directed to John Telting for supporting and maintaining the FIEStool pipeline. A.A.D. and H.W. would like to thank Jens Hoeijmakers and Nicholas Borsato for advice and help related to the installation and use of the molecfit program for FIES data. V.P.G. and L.V.T. would like to acknowledge the support of the Ministry of Science and Higher Education of the Russian Federation under the grant 075-15-2020-780 (N13.1902.21.0039).
Data availability
All the FIES data used in this paper are available in the Nordic Optical Telescope online FITS archive8. The FIEStool pipeline reduced spectra are also available in the NOT archive. Practically all the photometry observed by SAAF is available in AAVSO9 or otherwise available by request to the authors.
Appendix A FIES/NOT spectra of UX Ori
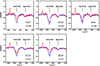 |
Fig. A.5 MgI 5184 Å and Fe II 5169 Å in the spectra of UX Ori during the brightness minima in 2021 (red). The dates of the observations and the V-band magnitudes are shown in the each plot. The blue line represents the line profiles obtained in the bright state of the star on Sep 5, 2020, with V= 9.98 mag. |
Spectra of UX Ori and quasi-simultaneous V-band photometry.
References
- Ansdell, M., Gaidos, E., Rappaport, S. A., et al. 2016, ApJ, 816, 69 [Google Scholar]
- Ballabio, G., Alexander, R. D., & Clarke, C. J. 2020, MNRAS, 496, 2932 [NASA ADS] [CrossRef] [Google Scholar]
- Bouvier, J., Alencar, S. H. P., Boutelier, T., et al. 2007, A&A, 463, 1017 [NASA ADS] [CrossRef] [EDP Sciences] [Google Scholar]
- Brittain, S. D., Kamp, I., Meeus, G., Oudmaijer, R. D., & Waters, L. B. F. M. 2023, Space Sci. Rev., 219, 7 [NASA ADS] [CrossRef] [Google Scholar]
- Djupvik, A. A., & Andersen, J. 2010, in Astrophysics and Space Science Proceedings, 14, Highlights of Spanish Astrophysics V, 211 [NASA ADS] [CrossRef] [Google Scholar]
- Ercolano, B., & Owen, J. E. 2010, MNRAS, 406, 1553 [NASA ADS] [Google Scholar]
- Ercolano, B., & Owen, J. E. 2016, MNRAS, 460, 3472 [Google Scholar]
- Flock, M., Fromang, S., Turner, N. J., & Benisty, M. 2017, ApJ, 835, 230 [CrossRef] [Google Scholar]
- Garcia, P. J. V., Ferreira, J., Cabrit, S., & Binette, L. 2001, A&A, 377, 589 [NASA ADS] [CrossRef] [EDP Sciences] [Google Scholar]
- Grinin, V. P. 2000, in Astronomical Society of the Pacific Conference Series, 219, Disks, Planetesimals, and Planets, eds. G. Garzón, C. Eiroa, D. de Winter, & T. J. Mahoney, 216 [NASA ADS] [Google Scholar]
- Grinin, V. P., & Rostopchina, A. N. 1996, Astron. Rep., 40, 171 [NASA ADS] [Google Scholar]
- Grinin, V. P., & Tambovtseva, L. V. 2011, Astron. Rep., 55, 704 [NASA ADS] [CrossRef] [Google Scholar]
- Grinin, V. P., Kiselev, N. N., Minikulov, N. K., Chernova, G. P., & Voshchinnikov, N. V. 1991, Ap&SS, 186, 283 [NASA ADS] [CrossRef] [Google Scholar]
- Grinin, V. P., The, P. S., de Winter, D., et al. 1994, A&A, 292, 165 [NASA ADS] [Google Scholar]
- Grinin, V. P., Kozlova, O. V., Natta, A., et al. 2001, A&A, 379, 482 [NASA ADS] [CrossRef] [EDP Sciences] [Google Scholar]
- Grinin, V. P., Mitskevich, A. S., & Tambovtseva, L. V. 2006, Astron. Lett., 32, 110 [NASA ADS] [CrossRef] [Google Scholar]
- Grinin, V. P., Tambovtseva, L. V., & Weigelt, G. 2012, A&A, 544, A45 [NASA ADS] [CrossRef] [EDP Sciences] [Google Scholar]
- Grinin, V. P., Tambovtseva, L. V., & Dmitriev, D. V. 2022, Astron. Rep., 66, 314 [NASA ADS] [CrossRef] [Google Scholar]
- Grinin, V. P., Tambovtseva, L. V., Djupvik, A. A., et al. 2023, MNRAS, 524, 4047 [NASA ADS] [CrossRef] [Google Scholar]
- Guzmán-Díaz, J., Mendigutía, I., Montesinos, B., et al. 2021, A&A, 650, A182 [NASA ADS] [CrossRef] [EDP Sciences] [Google Scholar]
- Kreplin, A., Weigelt, G., Kraus, S., et al. 2013, A&A, 551, A21 [NASA ADS] [CrossRef] [EDP Sciences] [Google Scholar]
- Kreplin, A., Madlener, D., Chen, L., et al. 2016, A&A, 590, A96 [NASA ADS] [CrossRef] [EDP Sciences] [Google Scholar]
- Kurosawa, R., Harries, T. J., & Symington, N. H. 2006, MNRAS, 370, 580 [NASA ADS] [CrossRef] [Google Scholar]
- McGinnis, P., Dougados, C., Alencar, S. H. P., Bouvier, J., & Cabrit, S. 2018, A&A, 620, A87 [NASA ADS] [CrossRef] [EDP Sciences] [Google Scholar]
- Mel’nikov, S. Y. 2001, Astron. Rep., 45, 686 [CrossRef] [Google Scholar]
- Muzerolle, J., D’Alessio, P., Calvet, N., & Hartmann, L. 2004, ApJ, 617, 406 [CrossRef] [Google Scholar]
- Natta, A., & Whitney, B. A. 2000, A&A, 364, 633 [NASA ADS] [Google Scholar]
- Natta, A., Grinin, V. P., Mannings, V., & Ungerechts, H. 1997, ApJ, 491, 885 [Google Scholar]
- Natta, A., Grinin, V. P., & Tambovtseva, L. V. 2000, ApJ, 542, 421 [NASA ADS] [CrossRef] [Google Scholar]
- Pascucci, I., Cabrit, S., Edwards, S., et al. 2023, in Astronomical Society of the Pacific Conference Series, 534, Protostars and Planets VII, eds. S. Inutsuka, Y. Aikawa, T. Muto, K. Tomida, & M. Tamura, 567 [NASA ADS] [Google Scholar]
- Rodgers, B., Wooden, D. H., Grinin, V., Shakhovsky, D., & Natta, A. 2002, ApJ, 564, 405 [NASA ADS] [CrossRef] [Google Scholar]
- Roggero, N., Bouvier, J., Rebull, L. M., & Cody, A. M. 2021, A&A, 651, A44 [NASA ADS] [CrossRef] [EDP Sciences] [Google Scholar]
- Rostopchina, A. N. 1999, Astron. Rep., 43, 113 [NASA ADS] [Google Scholar]
- Rostopchina-Shakhovskaja, A. N., Grinin, V. P., & Shakhovskoi, D. N. 2012, Astrophysics, 55, 147 [NASA ADS] [CrossRef] [Google Scholar]
- Safier, P. N. 1993, ApJ, 408, 115 [NASA ADS] [CrossRef] [Google Scholar]
- Shakhovskoi, D. N., Rostopchina, A. N., Grinin, V. P., & Minikulov, N. K. 2003, Astron. Rep., 47, 301 [NASA ADS] [CrossRef] [Google Scholar]
- Shulman, S. G., & Grinin, V. P. 2019, Astron. Lett., 45, 384 [NASA ADS] [CrossRef] [Google Scholar]
- Smette, A., Sana, H., Noll, S., et al. 2015, A&A, 576, A77 [NASA ADS] [CrossRef] [EDP Sciences] [Google Scholar]
- Stempels, E., & Telting, J. 2017, FIEStool: Automated data reduction for FIber- fed Echelle Spectrograph (FIES), Astrophysics Source Code Library [record ascl:1708.009] [Google Scholar]
- Tambovtseva, L. V., Grinin, V. P., & Weigelt, G. 2014, A&A, 562, A104 [NASA ADS] [CrossRef] [EDP Sciences] [Google Scholar]
- Tambovtseva, L. V., Grinin, V. P., & Dmitriev, D. V. 2020, Astron. Rep., 64, 1026 [NASA ADS] [CrossRef] [Google Scholar]
- Tannirkulam, A., Harries, T. J., & Monnier, J. D. 2007, ApJ, 661, 374 [NASA ADS] [CrossRef] [Google Scholar]
- Telting, J. H., Avila, G., Buchhave, L., et al. 2014, Astron. Nachr., 335, 41 [Google Scholar]
- Vioque, M., Oudmaijer, R. D., Baines, D., Mendigutía, I., & Pérez-Martínez, R. 2018, A&A, 620, A128 [NASA ADS] [CrossRef] [EDP Sciences] [Google Scholar]
FIEStool manual, Stempels 2005, Nordic Optical Telescope, see https://www.not.iac.es/instruments/fies/
We observe the same in NaI D. In general, NaI D and CaII do not correlate in behaviour, except for a few days (Fig. 2).
All Tables
Velocities of the discrete absorption components for UX Ori and RR Tau (in km s−1) in the coordinate system of the star.
All Figures
|
Fig. 1 V-band observations of UX Ori (black small circles) obtained mainly from observers (e.g. SAAF) and with a few additional data points from the NOT, are shown together with the epochs of FIES spectroscopy (large blue circles). When quasi-simultaneous SAAF or NOT V-band is lacking (empty blue circles), the nearest photometric point found by searching the AAVSO database is shown in Table A.1. |
| In the text | |
|
Fig. 2 UX Ori line profiles of Hα, Hβ, NaI D, CaII 8542 Å, and FeII 4924 Å during normal bright states in 2019. The line profiles are shown with respect to the stellar radial velocity (vertical line). The dates of the observations are shown in each plot. The left panel includes the values of the V-magnitudes, which are related to all the lines. The narrow emission components in the sodium lines are telluric lines (see text for details). |
| In the text | |
|
Fig. 3 The line profiles of Hα (black), Hβ (blue), and HeI + NaI D (red) in 2019 (upper panel) and in 2021 (lower panel). The central dip in Hα is located at about 10 km s−1 in 2019, and it is red-shifted to about 50 km s−1 in 2021. The dates and V-band magnitudes are given in each panel. |
| In the text | |
|
Fig. 4 Line profiles of Hα (left), Hβ (middle), and HeI 5876 Å + NaI 5889/5895 Å (right) in 2020. The dates of the observations are shown in each plot, and the left-hand panel includes the value of the V-band magnitude. |
| In the text | |
|
Fig. 5 Equivalent widths of OI 7774 Å (black), HeI 5876 Å (red), and NaI D2 (blue) vs. star brightness (V-band magnitudes) during different observational dates. |
| In the text | |
|
Fig. 6 Equivalent widths of HeI 5876 Å vs OI 7774 Å (left), NaI D2 vs OI 7774 Å (middle), and NaI D2 vs. HeI 5876 Å (right). The correlation coefficients are 0.94, 0.64, and 0.37, respectively. |
| In the text | |
|
Fig. 7 Upper panel (a, b): HeI 5876Å + NaI D lines (left) and OI 7774Å (right) in the spectra of UX Ori in the normal state on Sep 5, 2020, V = 9.98 mag (blue) and brightness minimum on Jan. 18, 2021, V = 12.48 mag (red). Lower panel (c, d): The same as in the upper panel but for RR Tau: in the normal state with V = 10.66 mag on Oct. 5, 2019, and in the weak state with V = 13.85 mag on Mar. 15, 2019. |
| In the text | |
|
Fig. 8 Forbidden oxygen lines in the spectra of UX Ori and RR Tau. Upper panel (a): [OI] 6300 Å lines in the spectra of UX Ori in the normal state with V = 9.98 mag on Sep. 5, 2020 (blue) and brightness minimum with V = 12.48 mag on Jan. 18, 2021 (red). Lower panel (b): The same as in the upper panel but for RR Tau with V = 10.66 mag on Oct. 5, 2019 (blue) and with V = 13.85 mag on Mar. 15, 2019 (red). |
| In the text | |
|
Fig. 9 Forbidden oxygen line [OI] 6300 Å during brightness minima. (a) [OI] 6300 Å profiles in the spectra of UX Ori during the minimum in 2021: Jan. 18, V = 12.48 mag (red); Jan. 20, V = 12.0 mag (blue); Jan. 24, V = 12.36 mag (green); Jan. 27, V = 12.27 mag (magenta), and Jan. 28, V = 12.37 mag (black). (b) Comparison of [OI] 6300 Å profiles in the brightness minimum of UX Ori (Jan 18, 2021, V = 12.48 mag, black) and RR Tau (Mar. 15, 2019, V = 13.85 mag, blue). |
| In the text | |
|
Fig. 10 Changes in the FeII multiplet in the bright state and during eclipses. Upper panel: UX Ori. The bright state (left), and the deep minimum (right). Lower panel: RR Tau. The bright state (left), and the deep minimum (right). Brightness in the visible is shown in each plot. The multiplet components are (in Å): 4924 (black), 5018 (red), and 5069 (blue). The dates of the bright and weak states of stars are the same as in Fig. 7. |
| In the text | |
|
Fig. 11 SiII 6347 Å line profiles averaged over five observational dates in the brightness minima (red) and maxima (blue) for UX Ori (a) and RR Tau (b). |
| In the text | |
|
Fig. 12 Line profiles of the sodium doublet NaI D1 and D2 (5889/5895 Å) with DACs in the spectra of UX Ori in 2020 (left) and 2022 (right) (upper panel) and RR Tau in 2019 (left) and 2020 (right) (lower panel). Spectra are shown in the stars’ coordinate systems. See details in the text and in Table 1. |
| In the text | |
|
Fig. 13 Changes in the equivalent widths (EW) of Hα (left panel) and Hβ (right panel) as a function of the observed brightness of UX Ori given as V-band magnitudes. We distinguish between (a) the total EW of the profile, (b) the EW of the red part of the profile where velocities are positive, and (c) the EW of the blue part of the profile where the velocity is negative. |
| In the text | |
|
Fig. 14 Comparison of the Hα emission line profiles, scaled to the same energetic units in the bright and faint states. Upper panel: the Hα emission line profiles in the normal bright state (blue) at V = 10.55 mag and two different faint states (red) of UX Ori. The epochs of each profile are given in the plots. In the two faint states the photometric measurement are (a) V = 12.48 mag and (b) V = 11.70 mag. Lower panel: same as in the upper panel, but for bright and faint states of RR Tau observed in 2019 (c) and 2022 (d). The photometric measurement in the bright and faint states are V = 10.86 mag and V = 13.77 mag (c), and V = 10.66 mag and V = 13.85 mag (d); see text for details. |
| In the text | |
|
Fig. 15 Si II 6347 Å in the spectra of UX Ori in 2021 (upper panel) and RR Tau in 2022 (lower panel, left) and in 2021 (lower panel, middle and right) during the brightness minima (red). The dates of the observations and V-band magnitudes are shown in each plot. The blue lines represents the bright state reference SiII line profile. Shown are the observed profiles in the bright states on Feb. 20, 2019, with V = 10.59 mag for UX Ori, and on Jan. 7, 2022, with V = 10.58 mag for RR Tau. |
| In the text | |
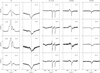 |
Fig. A.1 The same as in Fig. 2, but when entering the brightness minimum in December 2020. |
| In the text | |
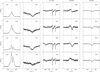 |
Fig. A.2 The same as in Fig. 2, but during brightness minimum in January 2021. |
| In the text | |
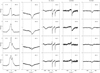 |
Fig. A.3 The same as in Fig. 2 at the beginning of the brightness minimum in November-December 2023. |
| In the text | |
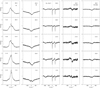 |
Fig. A.4 The same as in Fig. 2, but during the brightness minimum in January 2024. |
| In the text | |
|
Fig. A.5 MgI 5184 Å and Fe II 5169 Å in the spectra of UX Ori during the brightness minima in 2021 (red). The dates of the observations and the V-band magnitudes are shown in the each plot. The blue line represents the line profiles obtained in the bright state of the star on Sep 5, 2020, with V= 9.98 mag. |
| In the text | |
Current usage metrics show cumulative count of Article Views (full-text article views including HTML views, PDF and ePub downloads, according to the available data) and Abstracts Views on Vision4Press platform.
Data correspond to usage on the plateform after 2015. The current usage metrics is available 48-96 hours after online publication and is updated daily on week days.
Initial download of the metrics may take a while.