Fig. 2
Download original image
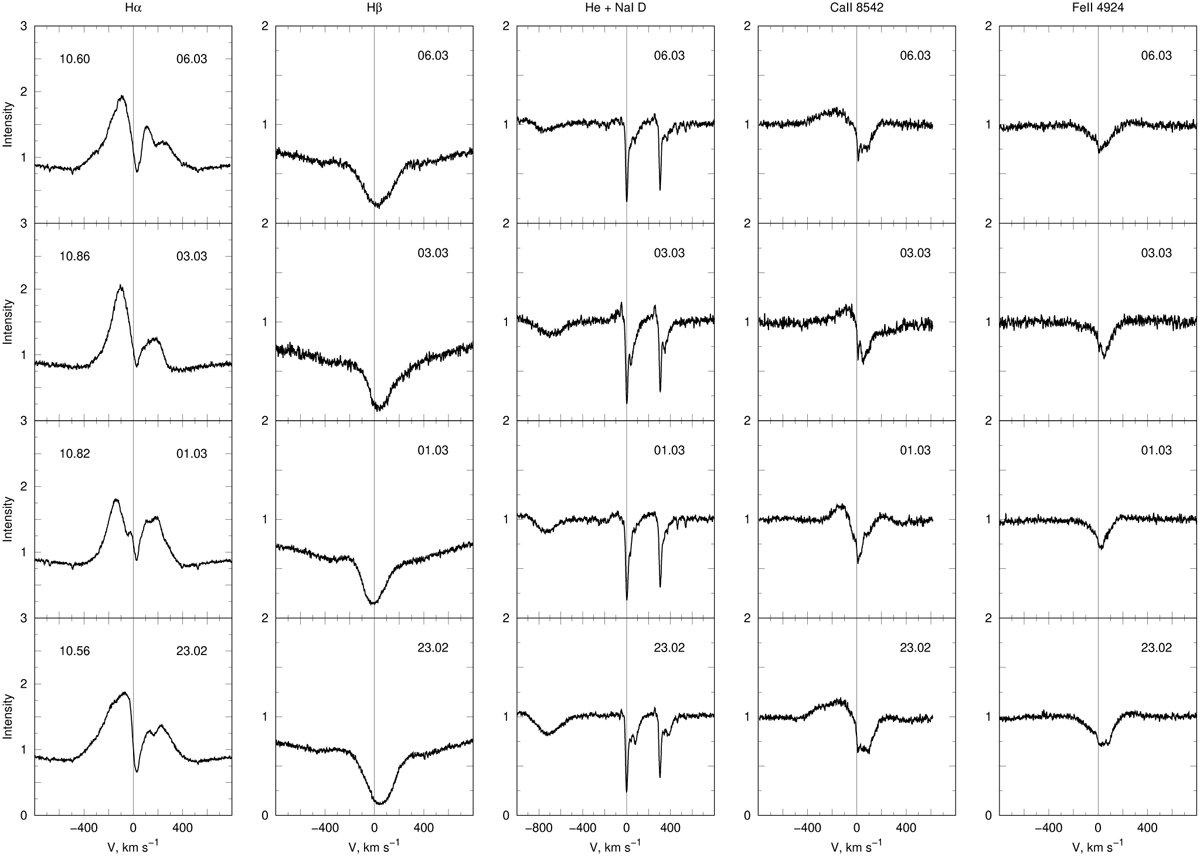
UX Ori line profiles of Hα, Hβ, NaI D, CaII 8542 Å, and FeII 4924 Å during normal bright states in 2019. The line profiles are shown with respect to the stellar radial velocity (vertical line). The dates of the observations are shown in each plot. The left panel includes the values of the V-magnitudes, which are related to all the lines. The narrow emission components in the sodium lines are telluric lines (see text for details).
Current usage metrics show cumulative count of Article Views (full-text article views including HTML views, PDF and ePub downloads, according to the available data) and Abstracts Views on Vision4Press platform.
Data correspond to usage on the plateform after 2015. The current usage metrics is available 48-96 hours after online publication and is updated daily on week days.
Initial download of the metrics may take a while.