Open Access
Fig. 4
Download original image
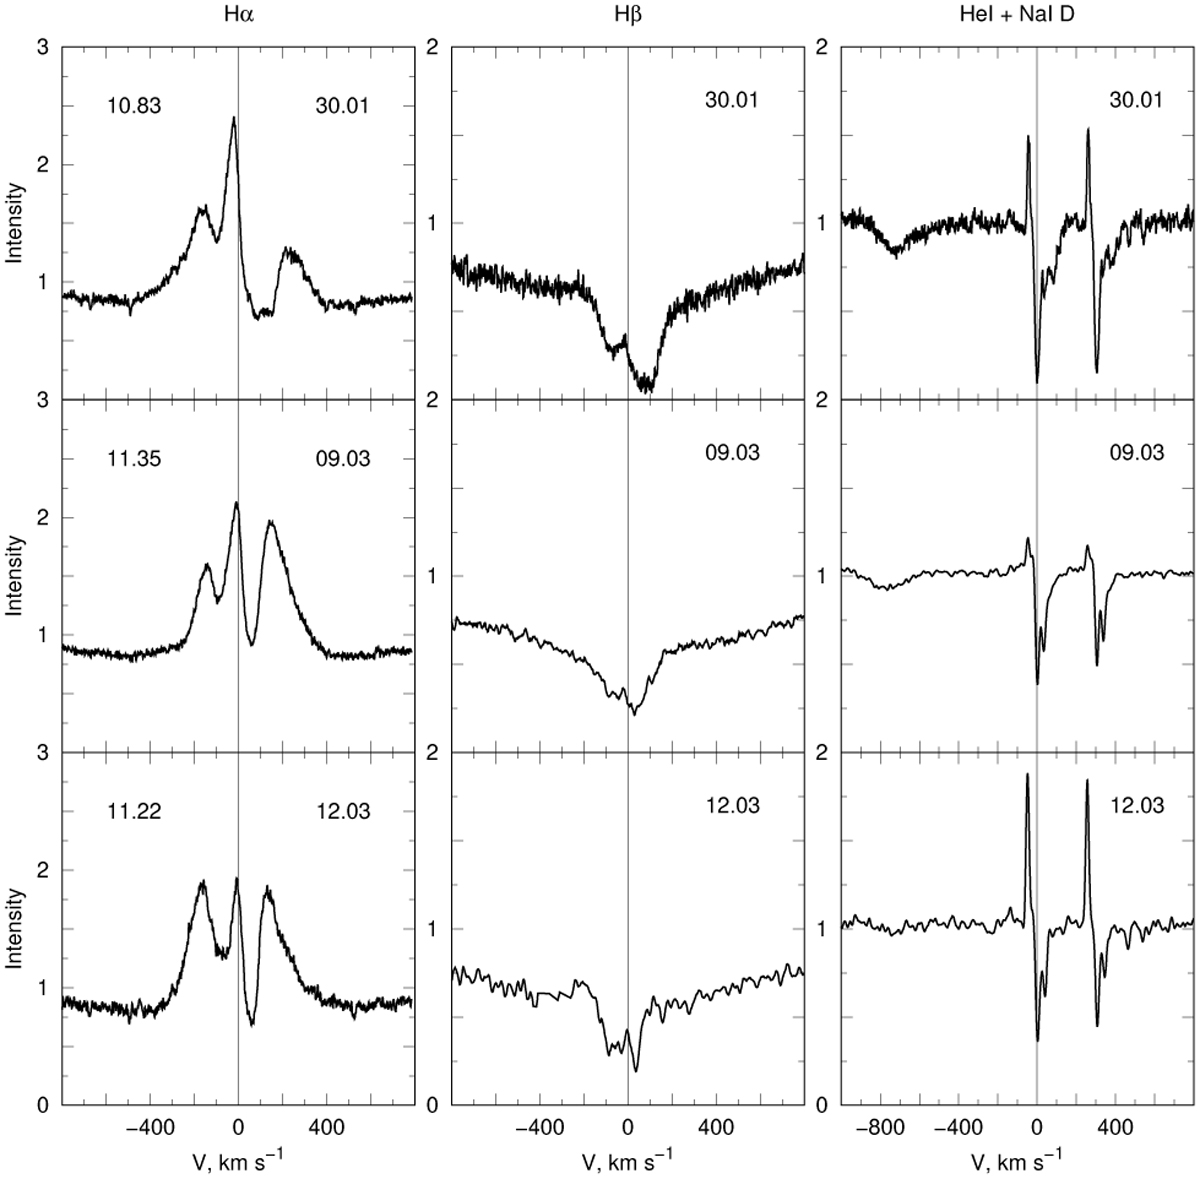
Line profiles of Hα (left), Hβ (middle), and HeI 5876 Å + NaI 5889/5895 Å (right) in 2020. The dates of the observations are shown in each plot, and the left-hand panel includes the value of the V-band magnitude.
Current usage metrics show cumulative count of Article Views (full-text article views including HTML views, PDF and ePub downloads, according to the available data) and Abstracts Views on Vision4Press platform.
Data correspond to usage on the plateform after 2015. The current usage metrics is available 48-96 hours after online publication and is updated daily on week days.
Initial download of the metrics may take a while.