| Issue |
A&A
Volume 694, February 2025
|
|
|---|---|---|
| Article Number | A123 | |
| Number of page(s) | 9 | |
| Section | Interstellar and circumstellar matter | |
| DOI | https://doi.org/10.1051/0004-6361/202451673 | |
| Published online | 06 February 2025 | |
Debris disks around M dwarfs: The Herschel DEBRIS survey
1
LUX, Observatoire de Paris, Université PSL, Sorbonne Université, CNRS,
75014
Paris,
France
2
Herzberg Institute of Astrophysics (HIA), National Research Council of Canada,
Victoria,
BC,
Canada
3
Department of Physics and Centre for Exoplanets and Habitability, University of Warwick,
Gibbet Hill Road,
Coventry
CV4 7AL,
UK
4
UK Astronomy Technology Centre (UKATC), Royal Observatory Edinburgh,
Blackford Hill,
Edinburgh,
EH9 3HJ,
UK
5
Airbus Defence and Space,
Gunnels Wood Rd,
Stevenage
SG1 2AS,
UK
6
Institute of Astronomy (IoA), University of Cambridge,
Madingley Road,
Cambridge,
CB3 0HA,
UK
7
Astrophysikalisches Institut und Universitätssternwarte, Friedrich-Schiller-Universität Jena,
Schillergäßchen 2-3,
07745
Jena,
Germany
8
School of Physics & Astronomy, CHART, Cardiff University,
Cardiff,
UK
9
Univ. Grenoble Alpes, CNRS, IPAG,
38000
Grenoble,
France
10
Astronomy Department, UC Berkeley,
601 Campbell Hall,
Berkeley
CA
94720-3411,
USA
11
Space Telescope Science Institute,
3700 San Martin Dr.,
Baltimore,
MD
21218,
USA
12
Physics and Astronomy, Center for Astrophysical Sciences, Johns Hopkins University,
Baltimore,
MD
21218,
USA
13
CNES,
18 avenue Edouard Belin,
31400
Toulouse,
France
★ Corresponding author; This email address is being protected from spambots. You need JavaScript enabled to view it.
Received:
26
July
2024
Accepted:
16
December
2024
Abstract
The Herschel open-time key program Disc Emission via a Bias-free Reconnaissance in the Infrared and Sub-millimeter (DEBRIS) is an unbiased survey of the nearest ∼100 stars for each stellar type A-M observed with a uniform photometric sensitivity to search for cold debris disks around them. The analysis of the Photoconductor Array Camera and Spectrometer photometric observations of the 94 DEBRIS M dwarfs of this program is presented in this paper, following upon two companion papers on the DEBRIS A-star and FGK-star subsamples. In the M-dwarf subsample, two debris disks have been detected, around the M3V dwarf GJ 581 and the M4V dwarf Fomalhaut C (LP 876-10). This result gives a disk detection rate of 2.1−0.7+ 2.7% at the 68% confidence level, significantly less than measured for earlier stellar types in the DEBRIS program. However, we show that the survey of the DEBRIS M-dwarf subsample is about ten times shallower than the surveys of the DEBRIS FGK subsamples when studied in the physical parameter space of the disk’s fractional dust luminosity versus blackbody radius. Furthermore, had the DEBRIS K-star subsample been observed at the same shallower depth in this parameter space, its measured disk detection rate would have been statistically consistent with the one found for the M-dwarf subsample. Hence, the incidence of debris disks does not appear to drop from the K subsample to the M subsample of the DEBRIS program, when considering disks in the same region of physical parameter space. An alternative explanation is that the only two bright disks discovered in the M-dwarf subsample would not, in fact, be statistically representative of the whole population.
Key words: circumstellar matter / stars: low-mass / planetary systems
© The Authors 2025
 Open Access article, published by EDP Sciences, under the terms of the Creative Commons Attribution License (https://creativecommons.org/licenses/by/4.0), which permits unrestricted use, distribution, and reproduction in any medium, provided the original work is properly cited.
This article is published in open access under the Subscribe to Open model. This email address is being protected from spambots. You need JavaScript enabled to view it. to support open access publication.
1 Introduction
A debris disk is a key component of a planetary system and a tracer of the history of its formation and its dynamics. It is made up of the surplus of km-sized planetesimals that were not able to agglomerate into larger planetary mass bodies during the protoplanetary phase. The Solar System’s Asteroid belt and Edgeworth-Kuiper belt are debris disks. The remnant planetesimals are not directly detectable when surrounding stars other than the Sun, however their orbit crossings at high velocity can result in destructive collisions that continuously regenerate micrometer-sized dust. This dust may reflect or absorb and reemit enough star light to make the disk observable. The physical and observational properties of debris disks have been reviewed in Lagrange et al. (2000), Wyatt (2008), Krivov (2010), Matthews et al. (2014), Hughes et al. (2018), and Wyatt (2020).
Surveys in the mid-infrared and far-infrared domains with IRAS (e.g., Oudmaijer et al. 1992; Mannings & Barlow 1998) and Spitzer (e.g., Trilling et al. 2008; Su et al. 2006) have shown that debris disks can be found around main sequence stars of all stellar types. Given these stars exhibit differences in stellar luminosities on the level of several orders of magnitude implies that planetesimal formation – a critical step in planet formation – is a robust process that can take place under a wide range of conditions. However, it is also widely known that debris disks have been more seldomly detected around M-type dwarfs than earlier type stars. This was previously shown in the surveys of M dwarfs in the mid-infrared (Plavchan et al. 2005, 2009), in the far-infrared with Spitzer (Gautier et al. 2007), and at (sub)millimeter wavelengths (Lestrade et al. 2006, 2009). This paucity of observed debris disks around M dwarfs seems surprising since in the early stage of their evolution, stars of all stellar types have similar incidence of protoplanetary disks according to observations of star forming regions, such as Taurus-Auriga and ρ Oph (e.g., Andrews & Williams 2005).
Nonetheless, these pre-Herschel surveys of debris disks have been biased through selections in age, metallicity of host stars, and binarity. The Herschel open-time key program Disc Emission via a Bias-free Reconnaissance in the Infrared and Sub-millimeter (DEBRIS) was designed to estimate and compare the true incidences of debris disks across all stellar types in unbiased subsamples; the nearest ~100 stars of each stellar type A-F-G-K-M have been surveyed to search for possible surrounding debris disks (Matthews et al. 2010) in a flux-limited sample, with a sensitivity that is approximately uniform across all stellar types in the far-infrared domain. This has offered the maximum sensitivity to cold dust, expected to be between 10 and 60 K for debris disks with blackbody radii between a few au and a few hundreds of au.
This paper presents the analysis of the 94 M dwarfs of the DEBRIS subsample to complement the analyses of the DEBRIS A-star subsample in Thureau et al. (2014) and the DEBRIS FGK- star subsamples in Sibthorpe et al. (2018). In Sect. 2, we describe the M-dwarf subsample, observations, and photometric measurements. In Sect. 3, we determine the disk detection rate in this subsample with the Herschel/Photoconductor Array Camera and Spectrometer (Herschel/PACS) observations. In Sect. 4, we present the Herschel/Spectral and Photometric Imaging Receiver (Herschel/SPIRE) observations of 25 M dwarfs of the subsample. In Sect. 5, we study the completeness of detections in the subsample in the fractional dust luminosity, fd, versus blackbody radius, RBB, parameter space. In Sect. 6, we show that two power laws are able to constrain the probability distributions of fd and RBB in the DEBRIS A, F, G, K subsamples. In Sect. 7, we place the DEBRIS survey into perspective, with the pre-Herschel searches for debris disks around M dwarfs in the far-infrared (FIR) domain and at longer wavelengths. We present our conclusions in Sect. 8.
2 Sample and observations
2.1 The DEBRIS Herschel survey
The full DEBRIS survey is a Herschel open-time key program designed to observe 446 nearby stars of stellar types A to M (Matthews et al. 2010). The DEBRIS sample is drawn from the Unbiased Nearby Stars catalogue (UNS; Phillips et al. 2010). The DEBRIS target list comprises the nearest systems (all-sky), subject to a cut in the predicted cirrus confusion level towards each system (>1.2 mJy at 100 µm), with details reported in Phillips et al. (2010). Consequently, the DEBRIS subsample which consists of about 100 stars of each stellar type is volume-limited and free of bias towards any particular stellar parameters or any prior knowledge of disc or planetary system. Since these are all field stars, and not generally members of clusters or associations, the stellar ages are uncorrelated. The M subsample comprises 94 M-stars and is complete to 8.6 pc excepting stars with high cirrus confusion level as mentioned. The ages of M-stars are notoriously difficult to establish and are most likely randomly distributed between ~ 100 Myr and ~ 10 Gyr in the sample.
2.2 Observations and data reduction
All targets were observed at 100 and 160 µm using the PACS photometer (Poglitsch et al. 2010) on board the space Herschel telescope (Pilbratt et al. 2010). The mini scan-map observing mode was used for all PACS observations. Two scans of each target were performed with a relative scanning angle of 40° to mitigate striping artifacts associated with 1/f noise. Scanmaps used a scanning rate of 20 arcsecs per second and were constructed of 3 arcmins scan legs with a separation of 4 arcsecs between legs. The nominal DEBRIS observations used 8 scanlegs per map and performed two map repeats per scanning direction. The data were reduced using Version 10.0 of the Herschel Interactive Pipeline Environment (HIPE) by Ott (2010). The standard pipeline processing steps were used and maps were made using the photProject task. The time ordered data were high-pass filtered, passing scales smaller than 66 arcsecs at 100 µm and 102 arcsecs at 160 µm (equivalent to a filter radius of 16 and 25 frames respectively), to remove low-frequency noise in the scan direction. Sources of >2σ were then identified in this first stage map to create a filter mask. The original data are then filtered a second time, using the derived mask to exclude bright sources, which would otherwise result in ringing artifacts, and a final map was then produced. The mean noise root mean square (rms) values are: 2.0 mJy/6.8″ beam (σ = 0.35mJy/b on mean) at 100 µm and 4.3 mJy/11.4″ beam (σ = 0.98mJy/b) at 160 µm.
In addition, a smaller survey of 25 M dwarfs (the 20 nearest and 5 more of interest, also PACS targets) was conducted with SPIRE (Griffin et al. 2010) to search for colder dust in larger belts than usually expected. The observations used the small-map mode, resulting in simultaneous 250, 350, and 500 µm images. The data were reduced using HIPE (version 7.0 build 1931), adopting the natural pixel scale of 6, 10, 14 arcsecs at 250, 350 and 500 µm, respectively. Their noise rms levels are: 6.1 mJy/18.2″ beam, 7.9 mJy/24.9″ beam, and 8.3 mJy/36.3″ beam at 250, 350, and 500 µm, respectively.
3 Disk incidence in the DEBRIS M-dwarf subsample observed with Herschel/PACS
We briefly summarize the procedures used to extract the relevant photometric data from the maps, referring to Kennedy et al. (2012a,b) for a more detailed description. For the whole DEBRIS survey, the flux densities of the targets were measured using a combination of point spread function (PSF) fitting and circular aperture photometry. Herschel calibration observations of bright stars were used as the PSF. They were rotated to the angle appropriate for a given observation because the maps were created in sky coordinates. The PSF fitting was used by default, with circular aperture photometry used where the PSF fitting residuals revealed resolved sources. The preference for PSF fitting is largely to allow for a mitigation of the effects of confusion from nearby point sources. As the positions of the target stars were well known, the PSF fitting routine was initialized at the expected star location (or locations in the case of multiple systems). We then used the MPFIT least-squares minimization IDL routine to find the best fitting point source model for each observation. For the aperture photometry, the uncertainty of the flux density was estimated by applying the same aperture at hundreds of randomly chosen positions in the map (see Kennedy et al. 2012a). In the whole DEBRIS survey, the PSF fitted flux densities were systematically lower by 20 percent when compared to aperture photometry due to flux lost in the wings of the PSF by filtering the images. Precisely, the typical aperture/PSF-fit flux density ratio based on a large number of targets was derived to be 1.19 at 100 µm, and 1.21 at 160 µm in Kennedy et al. (2012b).
The flux densities thus measured (Fλ), photospheric levels (Pλ), and uncertainties  at wavelengths of λ = 100 and 160 µm, for the 94 DEBRIS M dwarfs, are listed in Table 1. This table also gives the distances of the stars and their effective temperatures from the stellar atmospheric model PHOENIX Gaia best-fit to stellar data from the literature (Kennedy & Wyatt 2012; Kennedy et al. 2012b), as in Thureau et al. (2014) and Sibthorpe et al. (2018) for the other DEBRIS subsamples. We achieved an approximately uniform sensitivity of the survey at the levels of 2.0 mJy at 100 µm and 4.4 mJy at 160 µm.
In total, significant flux densities at the star positions were found for nineteen M dwarfs in the DEBRIS subsample (>3σ). Possible excesses above their photospheric level were searched by computing the flux excess significance of χλ at a wavelength of λ:
 (1)
(1)
The photometric data were taken from Table 1, where the 1σ PACS photometric uncertainties are  mJy and 2.6 mJy
  mJy depending on the target. The distributions of χ100 and χ160 for the M-dwarf subsample are shown in Fig. 1 and are approximately Gaussian and, satisfactorily, well centered on zero, implying that photospheric flux density estimates based on the PHOENIX stellar atmospheric model are unbiased. In DEBRIS, a disk is considered detected when χλ is larger than 3 at one or more wavelengths. According to this criterion, two debris disks were detected around the M3V star GJ 581 and the M4V star Fomalhaut C (Fom C, LP 876-10) in the M-dwarf subsample.
A slight excess on the positive side of both distributions in Fig. 1 is apparent when compared with the Gaussian computed for pure noise. This slight excess is an indication of a possible population of disks just below the detection criterion (χλ > 3 at one or both λ). In fact, quadratically combining χ100 and χ160 when both are positive in Table 1 yields three disks with  . We did not retain these as detections because this less conservative detection criterion was not adopted in the analysis of the other DEBRIS subsamples that we use for comparison in this paper.
The disk around GJ581 is resolved in the PACS images and modeling indicates a slightly extended disk with a resolved inner radius of 25 ± 12 au and a dust temperature significantly higher than blackbody, by a factor  , at this radius (Lestrade et al. 2012). As introduced by Booth et al. (2013), this phenomenon can be cast into the ratio, Γ = Rd/RBB, between the resolved disk radius, Rd , and the fictitious blackbody radius, RBB, resulting in a measured dust temperature of
  . Pawellek et al. (2014) carried out a detailed study of 34 debris disks with two different modelings of the SED based on the modified blackbody spectrum for one and on a grain size distribution for another. They found, for the former , Rd =38 au, along with Td = 35 ± 3 K and Γ = 5.4 ± 0.78 (hence RBB = 7 au) for the disk around around GJ581, using DEBRIS Herschel photometry. As argued in Pawellek et al. (2014), the latter model, with a grain size distribution, is likely more realistic and provides a lower Γ. However, we report here the result of the modified blackbody model for consistency with the published analysis of the other disk around an M-type DEBRIS star; namely, Fom C (quoted in the next paragraph and used in our study as well). Additionally, the fractional dust luminosity derived from the modeled SED is Ldust/L* = 8.9 × 10⁻⁵ (Lestrade et al. 2012).
The disk around Fom C was resolved with ALMA after its discovery with Herschel/PACS (Kennedy et al. 2014). The ALMA image at 0.87 mm and its azimuthally averaged brightness profile show a narrow belt with a radius of 26 au. The SED is modeled as a modified blackbody spectrum with photometry at 70, 100, 160, and 870 µm, and with upper limits of 250, 350, and 500 µm. These results indicate a dust temperature of 20 ± 4 K, which is hotter than the blackbody temperature at the resolved radius by the factor 1.4 ± 0.2 and so Γ = 2.0 ± 0.56, as analyzed in Cronin-Coltsmann et al. (2021). Hence, its blackbody radius, RBB, is 13 au. The fractional dust luminosity derived from their modeled SED is Ldust/L* = 1.5 ± 0.2 × 10⁻⁴.
Furthermore, we tried to improve the sensitivity of the survey to slightly resolved disks by using aperture photometry with an elliptical aperture, which is a better match to a disk randomly oriented in space that is projected as an ellipse on the sky. For this purpose, we optimized the recovery of any extended emission centered on the star position by computing the azimuthally averaged brightness profile from each image as a function of the semi-major axis, by incrementally varying the ellipticity and position angle of the elliptical aperture. For each increment, we searched for any statistically significant deviation of the computed profile from the PSF that would be the signature of a resolved disk. We validated this search method by successfully recovering all previously identified disks of other stellar types in DEBRIS, especially the nine resolved DEBRIS A-stars with their proper inclinations and orientations as modeled by Booth et al. (2013). However, in the whole survey (AFGKM- stars), no new disk was discovered with this method to add to those already identified with the excess significance χλ approach.
Finally, two disks discovered among the 94 targets of the DEBRIS M-dwarf subsample implies a detection rate of  , derived so that the integrated probability of the rate between the lower and upper uncertainties is 68% (see the appendix of Burgasser et al. 2003 for a detailed description of the computation of a low rate and its uncertainty based on the binomial distribution). This can be compared to the other rates within the whole DEBRIS program: 24 ± 5% for A-stars (Thureau et al. 2014) and
  for FGK-stars as estimated with the same method by Sibthorpe et al. (2018) who also noticed a trend across the three stellar types F, G, and K (see Table 2).
Examples of Herschel photometry of the DEBRIS M dwarfs.
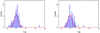 |
Fig. 1 Distributions of the excess significances χλ for the 94 DEBRIS M-type dwarfs observed with Herschel/PACS at λ=100 and 160 µm. The Gaussians shown in red are computed with σ = 1 and normalized with the total number of stars excluding the two detections to serve as a guide to characterize the observed noise distribution which is found to be well centered on zero. The excesses of the two disks GJ581 (χ100 = 12.1 and χ160 = 4.2) and Fom C (χ100 = 3.2 and χ160 = 7.2) at 100 and 160 µm are apparent in the plots. |
DEBRIS subsamples.
4 Herschel/SPIRE observations
With the SPIRE observations, we surveyed 25 M dwarfs of the DEBRIS subsample to search for colder dust in belts larger than usually expected. This resulted in no detection and a 3σ upper limits of ~24 mJy for their flux densities at 250, 350, and 500 µm (see Table 1). We derived a probability of 58% for no detection in our SPIRE survey of 25 dwarfs, using the binominal distribution with an average detection rate of 2.1%. With these SPIRE observations, an upper limit of 3 × 10⁻⁴ can be set on the fractional dust luminosity of a belt as large as ~100 au (10 K for the mean stellar luminosity of 0.0084 L⊙).
5 Completeness in the DEBRIS M-dwarf survey
The ability to detect excess emission from a disk in the survey varies from target to target. It depends on the properties of the disks (fractional dust luminosity, radius and dust composition) and of the stars (luminosity and distance), as well as on the exact depth of the survey. Following Sibthorpe et al. (2018) for the other DEBRIS subsamples, we evaluated this ability for the DEBRIS M-dwarf subsample in the 2D parameter space, fd versus RBB, by using the same canonical model of a narrow, circular belt filled with dust of fractional luminosity, fd, and emitting as a blackbody at a radius, RBB, under the irradiation of the star at the center of the system. The flux density of this dust thermal emission is:
 (2)
(2)
where the Planck function, Bν, is in W/m2/Hz/sr, the distance to Earth, d, is in pc, and the radius, RBB, is in au and related to the dust temperature T(RBB) through the standard relation in Sect. 3. For each point (fd, RBB) of the diagram, we calculated the fraction of the stars having disks that can be detected above the 3σ level in the sample. This 3σ level is taken to be the square of the quadratic sum of the PACS photometric uncertainty and photosphere uncertainty for each target. Combining all detection fractions calculated at all points (fd, RBB) provides a measurement of the completeness of the survey within the 2D parameter space of fd versus RBB.
Figure 2 shows the resulting completeness for the DEBRIS M-dwarf subsample. The region above the upper curve of the plot is 100 percent complete; that is, had all stars of the survey been surrounded with disks characterized by parameters within this region, they would all have been detected with the 3σ sensitivity of the PACS observations. In the plot, the completeness contours decrease in 10 percent steps down to the cross-hatched region, where disks cannot be detected around any of the stars in the subsample. The ample range of blackbody radii chosen between 0.1 and 200 au for Fig. 2 corresponds to blackbody dust temperature between 470 and 4.9 K in the subsample. The upper temperature is for the M0-type dwarfs of the subsample (L* = 0.08 L⊙). The lower value of 4.9 K is the asymptotic temperature reached when the interstellar radiation field (ISRF) starts to dominate the M-dwarf stellar radiation field at the belt radius (see Appendix A of Lestrade et al. 2009). The range of fd adopted in Fig. 2 is from the brightest known for FGK-star disks (~10−3) down to the faintest known, the Kuiper Belt (~10−7).
The two M-dwarf disks detected in the DEBRIS subsample have been added to Fig. 2 (RBB and fd of GJ581 and Fom C in Sect. 3). They lie above the 90% completeness contour, indicating that they had very little chance of being missed in the survey. We note that it is pointless to correct our measured M- dwarf detection rate for completeness in this sample with only two detections at 90%.
The comparison of the detection thresholds (0% level of completeness) among the five DEBRIS subsamples A, F, G, K, M in Fig. 3 indicates that the M-dwarf survey is increasingly shallower than the other surveys in the fd − RBB parameter space. This is the result of multiple factors; while the photometric depth of the observation is about the same for all DEBRIS subsamples, the sensitivity to disk emission is critically diminished for the M dwarfs because of their very low stellar luminosities; this is despite their being closer to the Earth (see Table 2).
In Fig. 2, we add the 12 disks detected in the DEBRIS K- star subsample (Sibthorpe et al. 2018) to show their positions relative to the completeness contours of the M-dwarf survey in parameter space of fd − RBB. This mapping allows us to mimic the observations of the K-stars with a degraded photometric sensitivity resulting in a shallower survey. The number of K-star disks detectable in these conditions can be predicted by summing the percent contour levels at the positions of the K-star disks in this diagram. This reduces the number of detected K- star disks to 4.9 that we rounded off by 5 detections to calculate the rate of  at the 68% confidence level for the subsample of 92 K-stars in using the same method as for the M-dwarf rate
  above. Hence, the two rates are statistically consistent within 1.1 times the quadratically combined uncertainties. Thus, the statistics indicates that disks around M dwarfs appear not to be markedly less common than around K-stars.
However, it is striking that the only two M-dwarf disks discovered stand high in Fig. 2 with a detection probability of >90% in the subsample, whilst there is no other disk found in the diagram at a lower probability, unlike the K-star disks in Fig. 2 and, more generally, unlike the FGK subsample in Fig. 4 of Sibthorpe et al. (2018). It is an instructive exercise to limit the detections in the K-star subsample to the two brightest disks and compute the probability of not detecting the ten other disks when mapped into the M-dwarf parameter space of fd − RBB. Using the positions of these ten K-star disks and completeness contours of Fig. 2, this probability is as low as 0.9%1. Thus, it is unlikely that the K-star survey would have detected only the two brightest disks. Hence, a caveat is that the two bright disks of the DEBRIS M-dwarf subsample found above the 90% completeness contour are possibly not statistically representative of the M-dwarf disk population and its true disk incidence could be lower; for instance, we have calculated with the binomial distribution that there is a probability of 50% of not finding a single disk in a sample of 94 stars and a disk incidence of 0.75%.
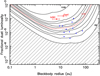 |
Fig. 2 Completeness of the DEBRIS M-dwarf survey at λ = 100 and 160 µm in the parameter space dust fractional luminosity versus black body radius. The contour lines show levels of completeness from zero to 100%, in steps of 10%. No detection is expected in the cross-hatched region and all disks are expected to be detected above the 100% contour. The two disks discovered in the DEBRIS M-dwarf subsample are marked in red. The detected disks of the DEBRIS K-star subsample in Sibthorpe et al. (2018) are marked as blue dots for comparison. |
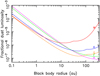 |
Fig. 3 Detection threshold (0% level of completeness) for the five DEBRIS subsamples A, F, G, K, and M, computed in using their 100 and 160 µm sensitivy threshold. |
6 Constraints on the probability distributions of fd and RBB in the DEBRIS subsamples
We now explain how we derived constraints on the probability distributions of the two main parameters characterizing debris disks, fractional dust luminosities, fd, and blackbody radii, RBB, by using the observations at 100 µm, the deepest of the survey. The build-up of a planetary system with its dusty belt(s) involves complex underlying processes, along with the growth of planetesimals in a protoplanetary disk, planet migration, fragmentation of planetesimals through collisional evolution of the belt(s), and dust removal, which may lead to the specific system properties (e.g., fd and RBB) experiencing a scale invariance and thereby distributed as power laws (Radicchi 2014).
We have undertaken this hypothesis, assuming two power law distributed variates for fd and ![Mathematical equation: ${R_{BB}}({\rm{d}}{N_f} \propto {\left[ {{f_d}} \right]^{{\alpha _f}}}{\rm{d}}{f_d}{\rm{andd}}{N_r} \propto {\left[ {{R_{BB}}} \right]^{{\alpha _r}}}{\rm{d}}{R_{BB}})$](/articles/aa/full_html/2025/02/aa51673-24/aa51673-24-eq18.png) in the simple blackbody model of Eq. (2), to simulate the dust thermal emissions around all the DEBRIS stars. In this model, the possible fractional dust luminosities are set between 10−7 and 10−3, while the possible blackbody radii between the lower and upper bounds, r1 and r2 , remain as free parameters. In practice, the power law distributed variates fd and RBB between their lower and upper bounds were generated from a uniformly distributed variate taken over [0,1], using the inversion method (Radicchi 2014 and Wolfram2). In our simulations, a disk is considered to be detected when its flux density is larger than three times the DEBRIS 100 µm photometric uncertainty in Table 1. We based our statistical study on a high number of simulations.
in the simple blackbody model of Eq. (2), to simulate the dust thermal emissions around all the DEBRIS stars. In this model, the possible fractional dust luminosities are set between 10−7 and 10−3, while the possible blackbody radii between the lower and upper bounds, r1 and r2 , remain as free parameters. In practice, the power law distributed variates fd and RBB between their lower and upper bounds were generated from a uniformly distributed variate taken over [0,1], using the inversion method (Radicchi 2014 and Wolfram2). In our simulations, a disk is considered to be detected when its flux density is larger than three times the DEBRIS 100 µm photometric uncertainty in Table 1. We based our statistical study on a high number of simulations.
First, we performed simulations of the subsamples A, F, G, K over a broad (but coarse) grid of values for all the free parameters αf, αr, r1, and r2 of the model. We found that the simulated disk detection rate and fd -distribution of the detected disks are particularly sensitive to αf (which must be negative) and to the range [r1, r2], which must be broad, but are not markedly sensitive to αr (which can be assumed zero). Then, after setting αr to zero, we refined the values of the three parameters αf, r1, and r2 with the following fitting procedure. The observations that constrain these parameters are the observed disk detection rate and distribution of the fractional dust luminosities of the detected disks in the subsample ( fd-distribution). We varied αf by small increments over [0, −3], as well as r1 over [0.1, 30 au] and r2 over [30, 300 au] to simulate each subsample and find the values of the triplet (αf, r1, r2) so that 1) the simulated and observed disk detection rates are made to match and 2) the observed and simulated fd -distributions of the detected disks are drawn from the same distribution. This last requirement is tested as the null hypothesis in the two-sample Kolmogorov-Smirnov test (e.g. Press et al. 1992). The sizes of the two samples are suitable for the K-S test; the observation samples (A, F, G, and K) comprise 12–22 detected disks, while the simulation samples comprise hundreds of detected disks from the 250 simulations performed for each stellar type. We adopted the standard criterion of 5% for the K-S significance level (Prob K-S; Eq. (13.5.5) in Press et al. 1992); below this, the null hypothesis (where the two samples are drawn from the same distribution) is rejected. With this procedure, the solution is when the observed and simulated disk detection rates match for the same triplet (αf, r1, r2) as the K-S significance level (Prob K-S) is maximized (at least as closely as possible in the case of subsample K). In Fig. 4, we plot, as functions of αf, both the simulated and observed disk detection rate and the K-S significance level for the optimum pair (r1, r2) found. For each subsample, the resulting parameters of the solution are in Table 3.
Finally, in Fig. 5, we show the observed and simulated fd -distributions of the detected disks for the solutions of Table 3. For each subsample, the two distributions agree reasonably well in shape (the K-S test in the previous figures quantitifies this degree of agreement). Differences are apparent but this is expected since the simulation histogram (blue) is based on 250 independent realizations while the observed histogram (red) is based on only one.
To test our fitting procedure, we generated many sets of mocked data for the stars of each DEBRIS subsample by adopting their luminosities, distances, and photometric uncertainties. We also set a priori values for r1, r2, and αf in the model, including ar = 0. All sets of mocked data were then analyzed with our procedure and we found that these a priori values could be recovered within ±10% and ±50% for af and r1, respectively, and  for r2. These relative uncertainties have been used to infer uncertainties of parameters in Table 3. In the course of these tests we also found that r1 (as well as r2) cannot be set to the same value for all four subsamples and so, these parameters must be intrinsic to each subsample with our model and the DEBRIS data.
We found that the K-S probability functions in Fig. 4 peak always well above the 5% threshold but it can differ significantly between mocked datasets generated with the same values for r1, r2, and af, but with different variates of RBB and fd. We also found that the K-S probability functions are significantly narrower when the photometric sensitivity is arbitrarily improved in the mocked data; namely, more disks are thus detected in the subsamples. We found also that the K-S probability functions can be more or less broad depending on the realizations and this must be a small number statistics effect.
From the resulting range of blackbody radii [r1, r2] of Table 3, we can derive a mean resolved disk radius for each DEBRIS subsample in using the factor Γ defined in Sect. 3. This factor can be evaluated with the empirical relation Γ-stellar luminosity found by Pawellek et al. (2014) in their extensive study of resolved disks observed from A to M-type stars, along with their complementary study of the impact of dust composition on this factor (Pawellek & Krivov 2015). These studies predict Γ =1.2, 1.6, 2.0, and 2.0 for the subsamples A, F, G, and K, respectively, using their mean stellar luminosities in Table 2. Thus, the averaged, resolved radii ((r1 + r2)/2 × Γ) calculated from Table 3 are: 108, 82, 77, and 60 au. Although these four averaged values estimated for subsamples A, F, G, and K are uncertain (dominated by a 100% uncertainty on r2), they show a decreasing behavior with stellar luminosity that reminds of the Matrà et al. (2018) empirical relation for mean resolved radii from the observations. However, we note that radius r1, taken on its own in our modelling, shows the opposite, i.e. an increasing trend with stellar luminosity.
Finally, we turn to the DEBRIS M-dwarf subsample of Table 1. The K-S test cannot be used because the observation sample comprises only two detected disks. So, we simply simulated the subsample by adopting the power-law model with the parameters of subsample K in Table 3 (αf = −0.49, αr = 0.0, r1 = 10, and r2 = 50 au). Thus, we find that the simulated detection rate of the DEBRIS M-dwarf subsample is 3.1 ± 1.9%, statistically consistent with the observed rate of  . We conclude from this that there is no evidence that the disk incidence drops markedly between the M and K DEBRIS subsamples.
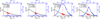 |
Fig. 4 Two-sample Kolmogorov-Smirnov test between the Herschel/PACS observations and the simulations of the DEBRIS subsamples A, F, G, and K. Each simulation assumes a power law of index of αf for the distribution of the fractional dust luminosities of the disks. In blue, we show the Kolmogorov-Smirnov test significance level (Prob K-S in %). The null hypothesis (i.e., that the two samples are drawn from the same distribution) can be rejected if the significance level is below 5% (horizontal dot-dash line). In black, connected dots are the simulated disk detection rates as a function of αf for r1 and r2 of Table 3. In red, the single filled large circle and vertical bar mark the observed detection rate and the unfilled large circles show its 1σ uncertainty range. The K-S significance level peaks closely at the same αf as the observed detection rate for the four subsamples A, F, G, and K, as expected with our fitting procedure and providing support for the power law model assumed. The fit parameters are given in Table 3. |
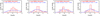 |
Fig. 5 Observed fd -distributions of the detected disks for the DEBRIS subsamples A, F, G, K reported in Thureau et al. (2014) and Sibthorpe et al. (2018), shown in red. The simulated fd -distributions of the detected disks resulting from our model and parameters in Table 3 are shown in blue. The relatively smooth simulation histogram in blue is based on 250 independent realizations, while the observed histogram in red on only one. The detection rate in parenthesis is the mean from these 250 simulations (the observed detection rate is reported in Table 2). The number densities have been normalized such that the total area under each histogram is unity. |
Model parameters.
7 Discussion
This conclusion can be put in the context of several arguments that have led, instead, to postulate on lower dustiness in disks around M dwarfs than around FGK-stars; M-dwarf disks could be less gravitationally self-stirred because of less massive bodies embedded in them (Kenyon & Bromley 2001; Krivov & Booth 2018) or be less dynamically stirred by lower mass planets orbiting close to disk edge (Wyatt et al. 1999; Pearce & Wyatt 2014); alternatively, they may have suffered a more severe depletion of their planetesimals during close stellar encounters when still embedded in the open clusters of their birth (Lestrade et al. 2011). Also, M dwarfs are generally older than earlier type stars, typically older than 1 Gyr, and their disks have suffered collisional erosion over a longer duration. To address this question, we developed a population model for the disks of the DEBRIS A, F, G, K, and M subsamples, initially assuming power laws for the probability distributions of their fractional dust luminosities, fd, and blackbody radii, RBB, in the simple black body model for the dust emission. With this model and the DEBRIS observations, we have found that the range, [r1, r2], for uniformly distributed RBB is intrinsic to each subsample and the fd -power law is moderately steep with an index αf of about −0.3 for subsample A and about −0.5 for subsamples F, G, and K. In our analysis, this latter value of the fractional dust luminosity index is also compatible with the DEBRIS M subsample, but cannot be directly derived from the limited number of detected disks. At this stage, we have no evidence that the DEBRIS M-dwarf disks are significantly less dusty.
Another important question concerning the M dwarfs is the presence of an abundant population of micron-sized grains in their disks or not. On one hand, the insignificant radiation pressure around these low luminosity stars implies that even the smallest grains cannot be expelled out of the system. On the other hand, it has been argued that M dwarfs are magnetically active and have corpuscular winds with high mass loss rates that would expel dust grains smaller than a few µm out of the system (Plavchan et al. 2005). However, it is now thought that high magnetic activity is rather rare in M-dwarfs after Wood et al. (2021) showed that the majority of them have winds similar in strength or even lower than the Sun. The presence of an abundant population of submicron-sized grains, necessarily with temperatures that are hotter than blackbody at the belt radius by a factor 2–3 (Backman & Paresce 1993), would modify their SED. As an illustration of this phenomenon, we compute in Fig. 6 the temperature of a grain as a function of its size, a, for dust made of dirty ice at a radial distance of 30 au from an M0-type dwarf (see the method in Appendix A of Lestrade et al. 2009). Then, using this temperature dependence and adopting the standard dust grain size distribution (dN ∝ a−3.5da between a minimum size of 0.01 µm and a maximum size of 4 cm), we evaluate the cumulative contribution of different grain size intervals to the flux density of this system in Fig. 7. The impact of the minimum grain size on the flux density can be read directly from the plot. This shows that the flux densities at wavelengths 100 and 160 µm are about halved if a minimum size of a few microns is taken and this would reduce disk detectability in the DEBRIS M-dwarf subsample. This plot shows also that nearly all the emission at λ = 11 μm comes from grains smaller than 1 μm. Consequently, the dearth of debris disks in the small sample of nine young (<500 Myr) M dwarfs observed at this wavelength by Plavchan et al. (2005) could be due to the dearth of these submicron-sized grains. They would have been blown out by high particle winds since in this case increased stellar magnetic activity is expected due to young age as suggested in their paper. Finally, for the field M dwarfs of the DEBRIS survey, we note that the modeling of the two disks discovered does show a dust temperature higher than that of a blackbody (GJ581 in Lestrade et al. 2012 and Fom C in Cronin-Coltsmann et al. 2021), making the presence of an abundant population of hot micron-sized grains in these two disks plausible.
Several searches for debris disks around M dwarfs have been conducted in the far-infrared domain since the first debris disks were discovered with the satellite IRAS (Aumann et al. 1984). The Spitɀer survey at 70 µm by Gautier et al. (2007) searched a sample of 41 nearby M dwarfs as part of a program to obtain, in an unbiased way, photometry of all stars lying within 5 pc of the Sun. No excess was found with a sensitivity estimated to be about twice as worst as that of DEBRIS. If the DEBRIS disk detection rate of 2.1% is applied to this Spitɀer sample, the probability of this outcome is 42% and so, it can be statistically expected. The Herschel/PACS survey at λ=100 and 160 µm by Kennedy et al. (2018) searched a sample of 21 nearby M dwarfs hosting low-mass planets and found a disk detection rate as high as 14%3. These authors carried out a statistical analysis that shows that this higher rate is more readily attributed to the superior depth of their survey (mean noise rms of 1.4 and 3.6 mJy/b at 100 and 160 µm, respectively) than to a correlation between planets and debris disks. The Herschel/PACS survey at λ=100 and 160 µm by Tanner et al. (2020) searched a sample of 20 nearby (<40pc) and young (<300 Myr) late-type stars (19 M dwarfs and one K7V type-star) with a sensitivity similar to DEBRIS and found confidently one new debris disk around the K7V star TYC 9340-437-1, resolved as a large belt with Rd = 96 au (Γ = 4) and with a high Ldust/L* of 1.2 × 10⁻³ placing this late K-star above the 100% completeness contour in Fig. 2. It is important to note that this star is part of the young and nearby β Pic moving group (20 Myr). The ALMA survey at λ=880 µm by Cronin-Coltsmann et al. (2023) searched 36 M dwarfs all selected in the β Pic Moving Group and found a disk detection rate of  significantly larger than in our unbiased DEBRIS M-dwarf subsample. We note that their selection criterion seems to be determinant since it has led to a ~75% detection rate of debris disks around F-type stars in the β Pic moving group (Pawellek et al. 2021), while a rate of
  is measured for the unbiased DEBRIS F-star subsample (Sibthorpe et al. 2018) corroborating the fact (well established now) that youth of the system significantly favors detectability.
The low disk detection rate we measured in the unbiased DEBRIS M-dwarf subsample must be attributed to the depth of our Herschel/PACS observations. To further investigate the incidence of disks around M dwarfs, a new, large, unbiased survey with ALMA with a significant improvement in depth and number of targets is needed but it currently requires a prohibitively long observing time (Luppe et al. 2020). Loss of sensitivity to large-scale emission with ALMA for the broadest disks may be a limitation however. Thus, the first step is to conduct a large unbiased survey capable of detecting the full variety of faint disks expected around M dwarfs with a new, large, single-dish telescope, such as the one proposed by the Atacama Large Aperture Submillimeter Telescope (AtLAST) project (Holland et al. 2019; Klaassen et al. 2024).
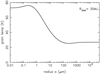 |
Fig. 6 Temperature of a spherical grain of dirty ice (water ice with embedded impurities of refractory materials of complex refractory index m = 1.33 – 0.09i) located at 30 au from an M0-dwarf (0.07 L⊙, 3850 K) and plotted as a function of its radius a. Large grains (a > 100 µm) are at the blackbody temperature of 26 K. |
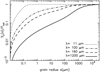 |
Fig. 7 Cumulative contribution of different grain size intervals to the flux density from emitting dust located at 30 au from an M0-dwarf (grain temperature in Fig. 6). The Herschel/PACS observations of the DEBRIS survey reported in this paper were conducted at λ =100 and 160 µm. As supplementary information, curves are provided for the early surveys at λ =11 μm by Plavchan et al. (2005) and at λ =1200 μm by Lestrade et al. (2009). Flux density Sν(a) integrated till grain size a is normalized by the total flux density Ftot integrated from minimum to maximum grain sizes of the plot. |
8 Conclusion
Within the Herschel Open Time Key program DEBRIS, we searched for debris disks around the 94 nearest M dwarfs observed optimally in the far infrared domain to detect cold dust emission with the Herschel/PACS observatory. This is the deepest, unbiased survey of low-mass stars to date. Two debris disks (GJ581 and Fomalhaut C) have been discovered and already reported in the literature. The resulting low disk detection rate of  is significantly less than in the other DEBRIS unbiased subsamples :
  for the FGK subsample (Sibthorpe et al. 2018) and 24±5% for the A subsample (Thureau et al. 2014). However, we show that the DEBRIS M-dwarf survey is about ten times shallower than the DEBRIS FGK survey in the dust fractional dust luminosities versus blackbody radii parameter space. We argue that, had the DEBRIS K-star subsample been observed at the same shallower depth in this physical parameter space, then its measured disk detection rate would have been statistically consistent with the one found for the M-dwarf subsample. Hence, in the DEBRIS survey, the incidence of debris disks does not appear to drop from the K to M subsamples when considering disks in the same region of the physical parameter space and despite the decline of their observed detection rates. One caveat is that since the two M-dwarf disks discovered in the survey are standing alone above the 90% completeness contour in the RBB – fd plane, they may not be statistically representative and, thus, they would not be applicable to studies aimed at properly deriving the disk incidence of the whole population.
Data availability
The full version of Table 1 is available in the online arXiv version of this paper and also available in electronic form at the CDS via anonymous ftp to cdsarc.cds.unistra.fr (130.79.128.5) or via https://cdsarc.cds.unistra.fr/viz-bin/cat/J/A+A/694/A123. Star properties, photometric data from Herschel/PACS and Herschel/SPIRE, and excesses above photospheric level used in this paper are provided.
Acknowledgements
We are in debt to the anonymous referee of our paper for providing insightful comments. The Herschel spacecraft was designed, built, tested, and launched under a contract to ESA managed by the Herschel/Planck Project team by an industrial consortium under the overall responsibility of the prime contractor Thales Alenia Space (Cannes), and including Astrium (Friedrichshafen) responsible for the payload module and for system testing at spacecraft level, Thales Alenia Space (Turin) responsible for the service module, and Astrium (Toulouse) responsible for the telescope, with in excess of a hundred subcontractors. J.-F.L. gratefully acknowledges the financial support of Centre National d’Etudes Spatiales (CNES). M.B. received funding from the European Union’s Horizon 2020 research and innovation program under grant agreement no. 951815 (AtLAST) and from the Deutsche Forschungsgemeinschaft (DFG) through grant Kr 2164/13–2.
References
- Andrews, S. M., & Williams, J. P. 2005, ApJ, 631, 1134 [Google Scholar]
- Aumann, H. H., Beichman, C. A., Gillett, F. C., et al. 1984, ApJ, 278, L23 [CrossRef] [Google Scholar]
- Backman, D. E., & Paresce, F. 1993, in Protostars and Planets III, eds. E. H. Levy, & J. I. Lunine (Tucson: University of Arizona Press), 1253 [Google Scholar]
- Booth, M., Kennedy, G., Sibthorpe, B., et al. 2013, MNRAS, 428, 1263 [Google Scholar]
- Burgasser, A. J., Kirkpatrick, J. D., Reid, I. N., et al. 2003, ApJ, 586, 512 [Google Scholar]
- Cronin-Coltsmann, P. F., Kennedy, G. M., Kalas, P., et al. 2021, MNRAS, 504, 4497 [NASA ADS] [CrossRef] [Google Scholar]
- Cronin-Coltsmann, P. F., Kennedy, G. M., Kral, Q., et al. 2023, MNRAS, 526, 5401 [NASA ADS] [CrossRef] [Google Scholar]
- Gautier, III, T. N., Rieke, G. H., Stansberry, J., et al. 2007, ApJ, 667, 527 [NASA ADS] [CrossRef] [Google Scholar]
- Griffin, M. J., Abergel, A., Abreu, A., et al. 2010, A&A, 518, L3 [EDP Sciences] [Google Scholar]
- Holland, W., Booth, M., Dent, W., et al. 2019, Astro2020: Decadal Survey on Astronomy and Astrophysics, science white papers, 80 [Google Scholar]
- Hughes, A. M., Duchêne, G., & Matthews, B. C. 2018, ARA&A, 56, 541 [Google Scholar]
- Kennedy, G. M., & Wyatt, M. C. 2012, MNRAS, 426, 91 [CrossRef] [Google Scholar]
- Kennedy, G. M., Wyatt, M. C., Sibthorpe, B., et al. 2012a, MNRAS, 421, 2264 [Google Scholar]
- Kennedy, G. M., Wyatt, M. C., Sibthorpe, B., et al. 2012b, MNRAS, 426, 2115 [NASA ADS] [CrossRef] [Google Scholar]
- Kennedy, G. M., Wyatt, M. C., Kalas, P., et al. 2014, MNRAS, 438, L96 [Google Scholar]
- Kennedy, G. M., Bryden, G., Ardila, D., et al. 2018, MNRAS, 476, 4584 [NASA ADS] [CrossRef] [Google Scholar]
- Kenyon, S. J., & Bromley, B. C. 2001, AJ, 121, 538 [NASA ADS] [CrossRef] [Google Scholar]
- Klaassen, P., Traficante, A., Beltrán, M. T., et al. 2024, Open Res. Europe, 4, 112 [CrossRef] [Google Scholar]
- Krivov, A. V. 2010, Res. Astron. Astrophys., 10, 383 [Google Scholar]
- Krivov, A. V., & Booth, M. 2018, MNRAS, 479, 3300 [NASA ADS] [CrossRef] [Google Scholar]
- Lagrange, A.-M., Backman, D. E., & Artymowicz, P. 2000, Protostars and Planets IV (Tucson: University of Arizona Press), 639 [Google Scholar]
- Lestrade, J.-F., Wyatt, M. C., Bertoldi, F., Dent, W. R. F., & Menten, K. M. 2006, A&A, 460, 733 [NASA ADS] [CrossRef] [EDP Sciences] [Google Scholar]
- Lestrade, J.-F., Wyatt, M. C., Bertoldi, F., Menten, K. M., & Labaigt, G. 2009, A&A, 506, 1455 [NASA ADS] [CrossRef] [EDP Sciences] [Google Scholar]
- Lestrade, J.-F., Morey, E., Lassus, A., & Phou, N. 2011, A&A, 532, A120 [NASA ADS] [CrossRef] [EDP Sciences] [Google Scholar]
- Lestrade, J.-F., Matthews, B. C., Sibthorpe, B., et al. 2012, A&A, 548, A86 [NASA ADS] [CrossRef] [EDP Sciences] [Google Scholar]
- Luppe, P., Krivov, A. V., Booth, M., & Lestrade, J.-F. 2020, MNRAS, 499, 3932 [NASA ADS] [CrossRef] [Google Scholar]
- Mannings, V., & Barlow, M. J. 1998, ApJ, 497, 330 [Google Scholar]
- Matrà, L., Marino, S., Kennedy, G. M., et al. 2018, ApJ, 859, 72 [Google Scholar]
- Matthews, B. C., Sibthorpe, B., Kennedy, G., et al. 2010, A&A, 518, L135 [NASA ADS] [CrossRef] [EDP Sciences] [Google Scholar]
- Matthews, B. C., Krivov, A. V., Wyatt, M. C., Bryden, G., & Eiroa, C. 2014, Protostars and Planets VI (Tucson: University of Arizona Press), 521 [Google Scholar]
- Ott, S. 2010, ASP Conf. Ser., 434, 139 [Google Scholar]
- Oudmaijer, R. D., van der Veen, W. E. C. J., Waters, L. B. F. M., et al. 1992, A&AS, 96, 625 [NASA ADS] [Google Scholar]
- Pawellek, N., & Krivov, A. V. 2015, MNRAS, 454, 3207 [Google Scholar]
- Pawellek, N., Krivov, A. V., Marshall, J. P., et al. 2014, ApJ, 792, 65 [Google Scholar]
- Pawellek, N., Wyatt, M., Matrà, L., Kennedy, G., & Yelverton, B. 2021, MNRAS, 502, 5390 [NASA ADS] [CrossRef] [Google Scholar]
- Pearce, T. D., & Wyatt, M. C. 2014, MNRAS, 443, 2541 [NASA ADS] [CrossRef] [Google Scholar]
- Phillips, N. M., Greaves, J. S., Dent, W. R. F., et al. 2010, MNRAS, 403, 1089 [NASA ADS] [CrossRef] [Google Scholar]
- Pilbratt, G. L., Riedinger, J. R., Passvogel, T., et al. 2010, A&A, 518, L1 [NASA ADS] [CrossRef] [EDP Sciences] [Google Scholar]
- Plavchan, P., Jura, M., & Lipscy, S. J. 2005, ApJ, 631, 1161 [NASA ADS] [CrossRef] [Google Scholar]
- Plavchan, P., Werner, M. W., Chen, C. H., et al. 2009, ApJ, 698, 1068 [Google Scholar]
- Poglitsch, A., Waelkens, C., Geis, N., et al. 2010, A&A, 518, L2 [NASA ADS] [CrossRef] [EDP Sciences] [Google Scholar]
- Press, W. H., Teukolsky, S. A., Vetterling, W. T., & Flannery, B. P. 1992, Numerical Recipes in FORTRAN. The Art of Scientific Computing (Cambridge: Cambridge University Press) [Google Scholar]
- Radicchi, F. 2014, Phys. Rev. E, 90, 050801 [NASA ADS] [CrossRef] [Google Scholar]
- Sibthorpe, B., Kennedy, G. M., Wyatt, M. C., et al. 2018, MNRAS, 475, 3046 [Google Scholar]
- Su, K. Y. L., Rieke, G. H., Stansberry, J. A., et al. 2006, ApJ, 653, 675 [Google Scholar]
- Tanner, A., Plavchan, P., Bryden, G., et al. 2020, PASP, 132, 084401 [NASA ADS] [CrossRef] [Google Scholar]
- Thureau, N. D., Greaves, J. S., Matthews, B. C., et al. 2014, MNRAS, 445, 2558 [NASA ADS] [CrossRef] [Google Scholar]
- Trilling, D. E., Bryden, G., Beichman, C. A., et al. 2008, ApJ, 674, 1086 [Google Scholar]
- Wood, B. E., Müller, H.-R., Redfield, S., et al. 2021, ApJ, 915, 37 [NASA ADS] [CrossRef] [Google Scholar]
- Wyatt, M. C. 2008, ARA&A, 46, 339 [Google Scholar]
- Wyatt, M. 2020, in The Trans-Neptunian Solar System, eds. D. Prialnik, M. A. Barucci, & L. Young (Amsterdam: Elsevier), 351 [CrossRef] [Google Scholar]
- Wyatt, M. C., Dermott, S. F., Telesco, C. M., et al. 1999, ApJ, 527, 918 [Google Scholar]
The detailed calculation is : (1 − 0.70) × (1 − 0.68) × (1 − 0.42) × (1 − 0.40) × (1 − 0.29) × (1 − 0.27) × (1 − 0.20) × (1 − 0.18) × (1 − 0.12) × (1 − 0.08).
We add that the uncertainties of this rate are  at a 68% confidence level using the same methodology as in Sect. 3.
All Tables
All Figures
|
Fig. 1 Distributions of the excess significances χλ for the 94 DEBRIS M-type dwarfs observed with Herschel/PACS at λ=100 and 160 µm. The Gaussians shown in red are computed with σ = 1 and normalized with the total number of stars excluding the two detections to serve as a guide to characterize the observed noise distribution which is found to be well centered on zero. The excesses of the two disks GJ581 (χ100 = 12.1 and χ160 = 4.2) and Fom C (χ100 = 3.2 and χ160 = 7.2) at 100 and 160 µm are apparent in the plots. |
| In the text | |
|
Fig. 2 Completeness of the DEBRIS M-dwarf survey at λ = 100 and 160 µm in the parameter space dust fractional luminosity versus black body radius. The contour lines show levels of completeness from zero to 100%, in steps of 10%. No detection is expected in the cross-hatched region and all disks are expected to be detected above the 100% contour. The two disks discovered in the DEBRIS M-dwarf subsample are marked in red. The detected disks of the DEBRIS K-star subsample in Sibthorpe et al. (2018) are marked as blue dots for comparison. |
| In the text | |
|
Fig. 3 Detection threshold (0% level of completeness) for the five DEBRIS subsamples A, F, G, K, and M, computed in using their 100 and 160 µm sensitivy threshold. |
| In the text | |
|
Fig. 4 Two-sample Kolmogorov-Smirnov test between the Herschel/PACS observations and the simulations of the DEBRIS subsamples A, F, G, and K. Each simulation assumes a power law of index of αf for the distribution of the fractional dust luminosities of the disks. In blue, we show the Kolmogorov-Smirnov test significance level (Prob K-S in %). The null hypothesis (i.e., that the two samples are drawn from the same distribution) can be rejected if the significance level is below 5% (horizontal dot-dash line). In black, connected dots are the simulated disk detection rates as a function of αf for r1 and r2 of Table 3. In red, the single filled large circle and vertical bar mark the observed detection rate and the unfilled large circles show its 1σ uncertainty range. The K-S significance level peaks closely at the same αf as the observed detection rate for the four subsamples A, F, G, and K, as expected with our fitting procedure and providing support for the power law model assumed. The fit parameters are given in Table 3. |
| In the text | |
|
Fig. 5 Observed fd -distributions of the detected disks for the DEBRIS subsamples A, F, G, K reported in Thureau et al. (2014) and Sibthorpe et al. (2018), shown in red. The simulated fd -distributions of the detected disks resulting from our model and parameters in Table 3 are shown in blue. The relatively smooth simulation histogram in blue is based on 250 independent realizations, while the observed histogram in red on only one. The detection rate in parenthesis is the mean from these 250 simulations (the observed detection rate is reported in Table 2). The number densities have been normalized such that the total area under each histogram is unity. |
| In the text | |
|
Fig. 6 Temperature of a spherical grain of dirty ice (water ice with embedded impurities of refractory materials of complex refractory index m = 1.33 – 0.09i) located at 30 au from an M0-dwarf (0.07 L⊙, 3850 K) and plotted as a function of its radius a. Large grains (a > 100 µm) are at the blackbody temperature of 26 K. |
| In the text | |
|
Fig. 7 Cumulative contribution of different grain size intervals to the flux density from emitting dust located at 30 au from an M0-dwarf (grain temperature in Fig. 6). The Herschel/PACS observations of the DEBRIS survey reported in this paper were conducted at λ =100 and 160 µm. As supplementary information, curves are provided for the early surveys at λ =11 μm by Plavchan et al. (2005) and at λ =1200 μm by Lestrade et al. (2009). Flux density Sν(a) integrated till grain size a is normalized by the total flux density Ftot integrated from minimum to maximum grain sizes of the plot. |
| In the text | |
Current usage metrics show cumulative count of Article Views (full-text article views including HTML views, PDF and ePub downloads, according to the available data) and Abstracts Views on Vision4Press platform.
Data correspond to usage on the plateform after 2015. The current usage metrics is available 48-96 hours after online publication and is updated daily on week days.
Initial download of the metrics may take a while.