Fig. 5
Download original image
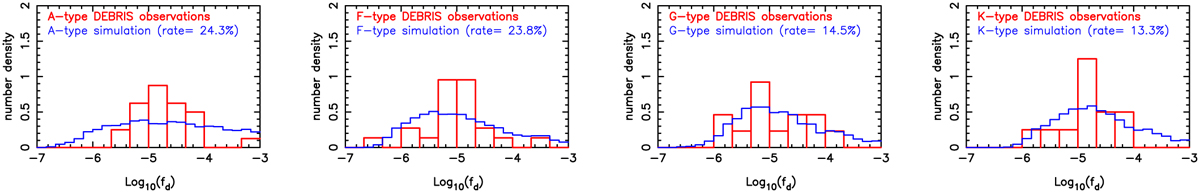
Observed fd -distributions of the detected disks for the DEBRIS subsamples A, F, G, K reported in Thureau et al. (2014) and Sibthorpe et al. (2018), shown in red. The simulated fd -distributions of the detected disks resulting from our model and parameters in Table 3 are shown in blue. The relatively smooth simulation histogram in blue is based on 250 independent realizations, while the observed histogram in red on only one. The detection rate in parenthesis is the mean from these 250 simulations (the observed detection rate is reported in Table 2). The number densities have been normalized such that the total area under each histogram is unity.
Current usage metrics show cumulative count of Article Views (full-text article views including HTML views, PDF and ePub downloads, according to the available data) and Abstracts Views on Vision4Press platform.
Data correspond to usage on the plateform after 2015. The current usage metrics is available 48-96 hours after online publication and is updated daily on week days.
Initial download of the metrics may take a while.