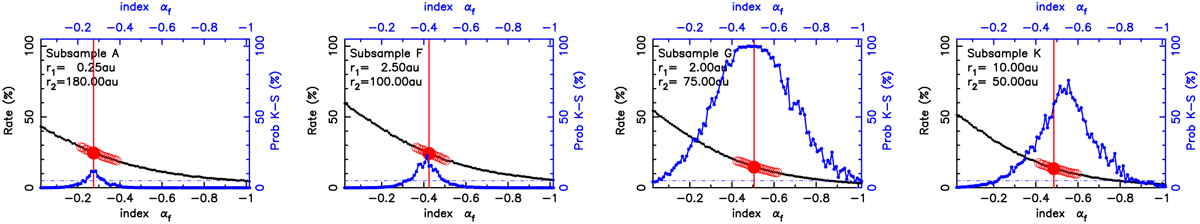
Fig. 4
Download original image
Two-sample Kolmogorov-Smirnov test between the Herschel/PACS observations and the simulations of the DEBRIS subsamples A, F, G, and K. Each simulation assumes a power law of index of αf for the distribution of the fractional dust luminosities of the disks. In blue, we show the Kolmogorov-Smirnov test significance level (Prob K-S in %). The null hypothesis (i.e., that the two samples are drawn from the same distribution) can be rejected if the significance level is below 5% (horizontal dot-dash line). In black, connected dots are the simulated disk detection rates as a function of αf for r1 and r2 of Table 3. In red, the single filled large circle and vertical bar mark the observed detection rate and the unfilled large circles show its 1σ uncertainty range. The K-S significance level peaks closely at the same αf as the observed detection rate for the four subsamples A, F, G, and K, as expected with our fitting procedure and providing support for the power law model assumed. The fit parameters are given in Table 3.
Current usage metrics show cumulative count of Article Views (full-text article views including HTML views, PDF and ePub downloads, according to the available data) and Abstracts Views on Vision4Press platform.
Data correspond to usage on the plateform after 2015. The current usage metrics is available 48-96 hours after online publication and is updated daily on week days.
Initial download of the metrics may take a while.