Fig. 7
Download original image
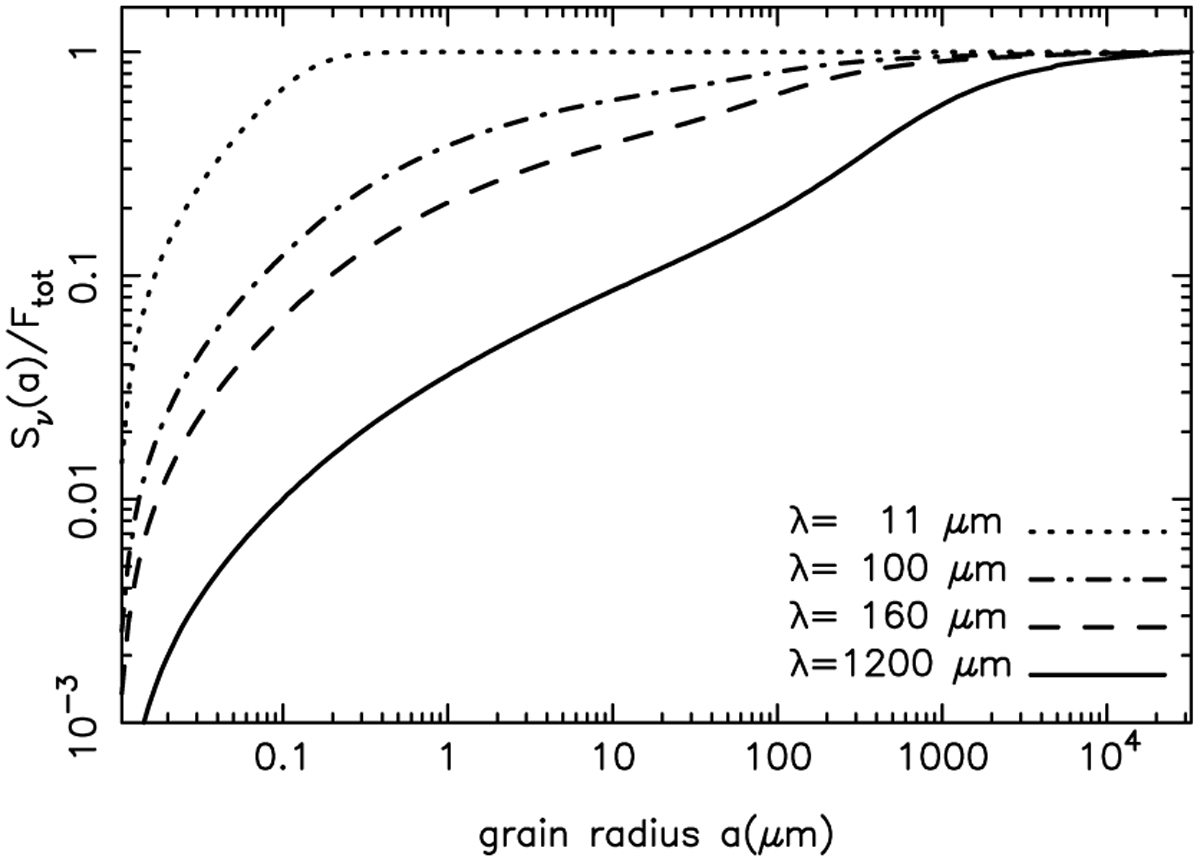
Cumulative contribution of different grain size intervals to the flux density from emitting dust located at 30 au from an M0-dwarf (grain temperature in Fig. 6). The Herschel/PACS observations of the DEBRIS survey reported in this paper were conducted at λ =100 and 160 µm. As supplementary information, curves are provided for the early surveys at λ =11 μm by Plavchan et al. (2005) and at λ =1200 μm by Lestrade et al. (2009). Flux density Sν(a) integrated till grain size a is normalized by the total flux density Ftot integrated from minimum to maximum grain sizes of the plot.
Current usage metrics show cumulative count of Article Views (full-text article views including HTML views, PDF and ePub downloads, according to the available data) and Abstracts Views on Vision4Press platform.
Data correspond to usage on the plateform after 2015. The current usage metrics is available 48-96 hours after online publication and is updated daily on week days.
Initial download of the metrics may take a while.