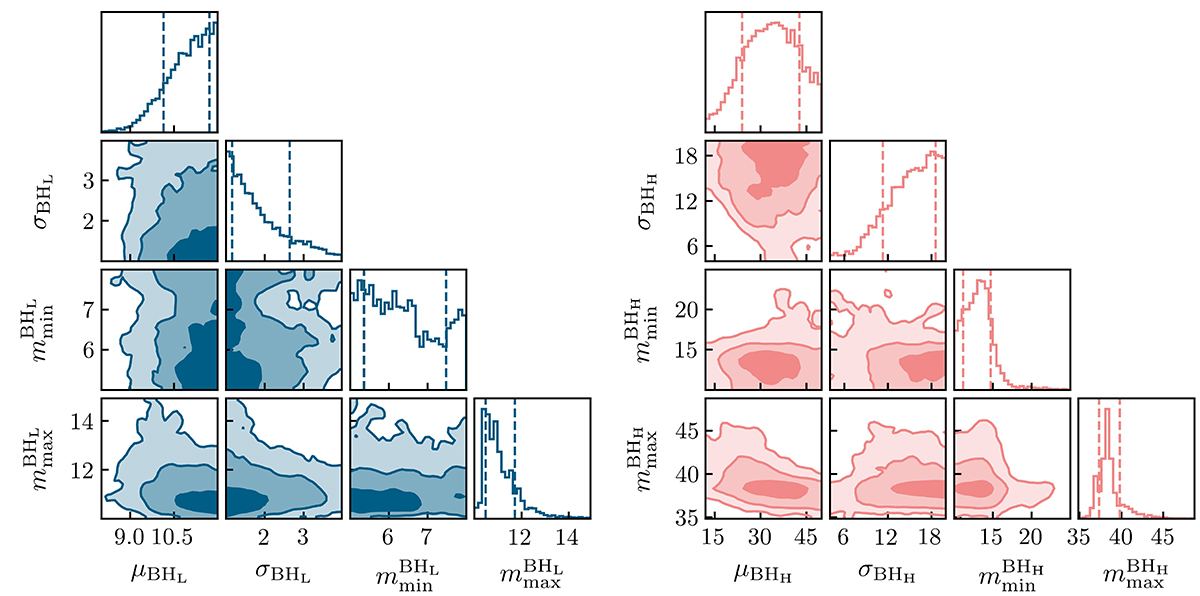
Fig. B.1.
Download original image
Mass hyperparameter posteriors of the peak components in the COMPACTNESS PEAKS model. Left panel: the lower mass (BHL) peak where μBHL is the mean of the peak, σBHL is the width of the peak and mminBHL and mmaxBHL are the minimum and maximum mass of the peak. Right panel: the upper mass (BHL) peak where μBHH is the mean of the peak, σBHH is the width of the peak and mminBHH and mmaxBHH are the minimum and maximum mass of the peak. The credible intervals on the 2D posterior distributions are at 1σ, 2σ and 3σ, using increasingly light shading. The intervals on the 1D posterior distributions are at 1σ.
Current usage metrics show cumulative count of Article Views (full-text article views including HTML views, PDF and ePub downloads, according to the available data) and Abstracts Views on Vision4Press platform.
Data correspond to usage on the plateform after 2015. The current usage metrics is available 48-96 hours after online publication and is updated daily on week days.
Initial download of the metrics may take a while.