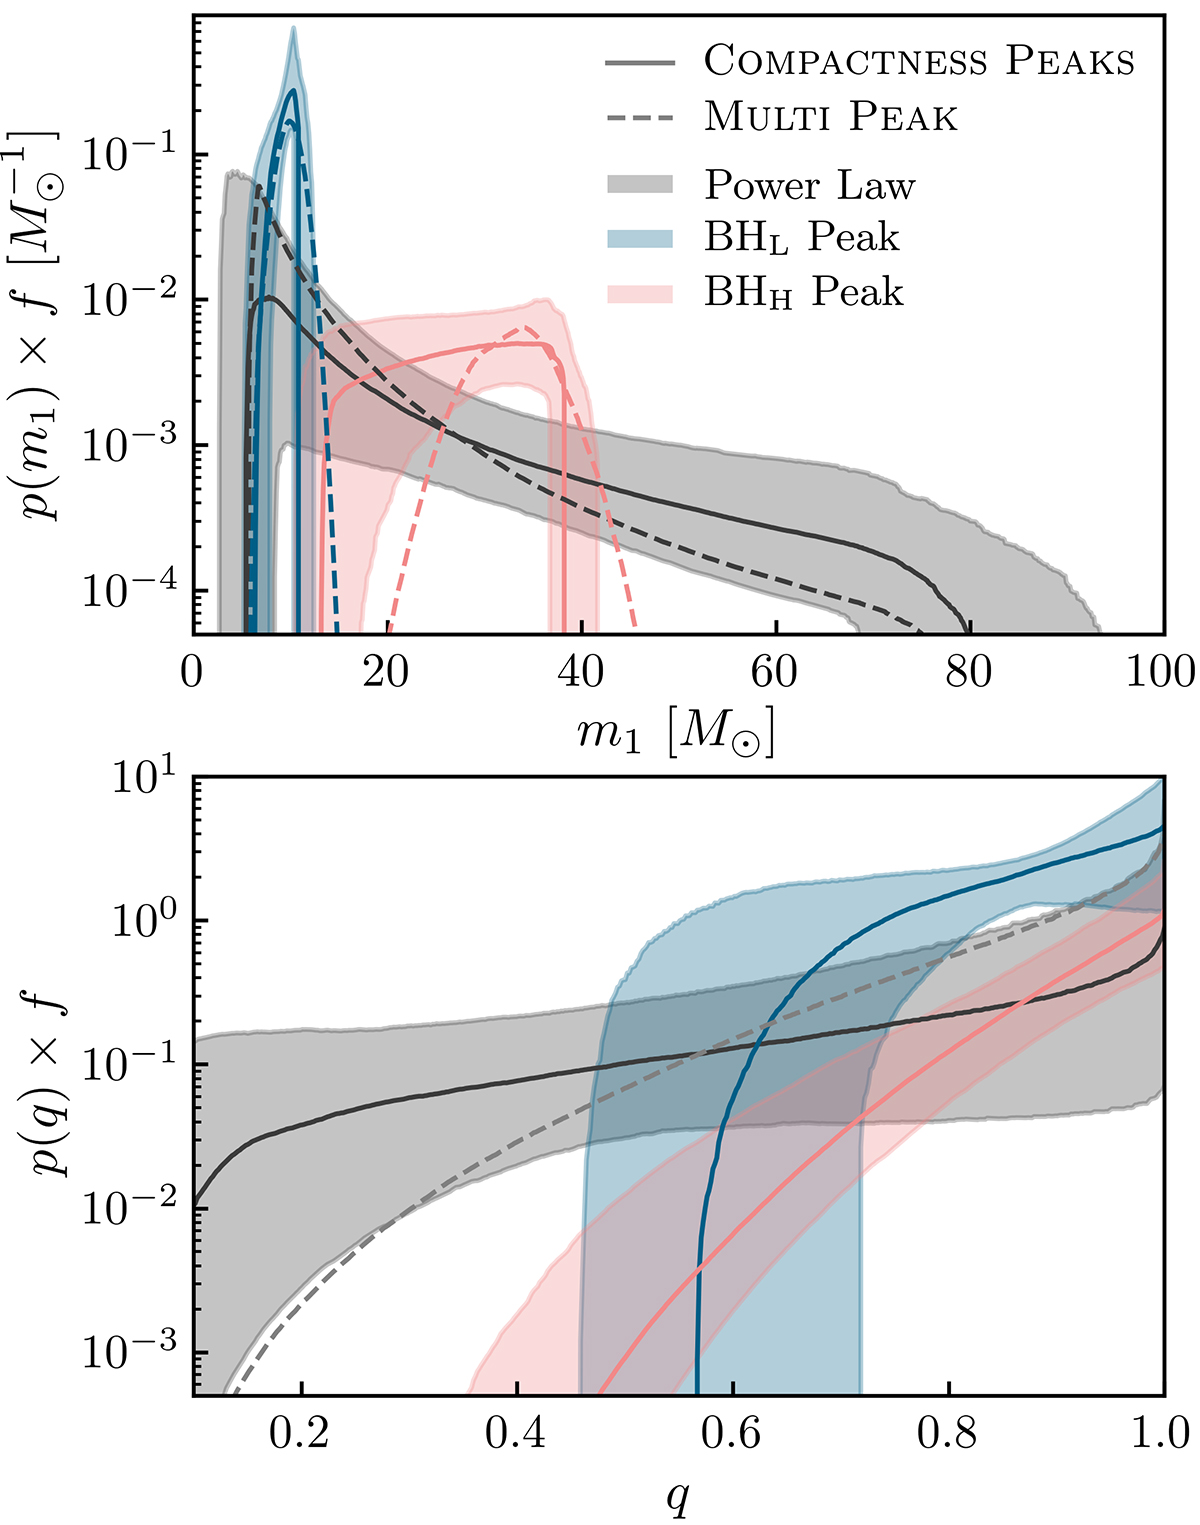
Fig. 3.
Download original image
Population distributions for primary mass (m1, top panel) and mass ratio (q, bottom panel) using the COMPACTNESS PEAKS model for BBH mergers scaled by the fraction of events in the BHL Peak (blue), BHH Peak (pink), and POWER LAW (black) components. The solid curve is the median of the distribution and the shaded regions represent the 90% credible interval. The dashed line represents the median of the distribution for the MULTI PEAK model, which has the same mass ratio distribution for all components.
Current usage metrics show cumulative count of Article Views (full-text article views including HTML views, PDF and ePub downloads, according to the available data) and Abstracts Views on Vision4Press platform.
Data correspond to usage on the plateform after 2015. The current usage metrics is available 48-96 hours after online publication and is updated daily on week days.
Initial download of the metrics may take a while.