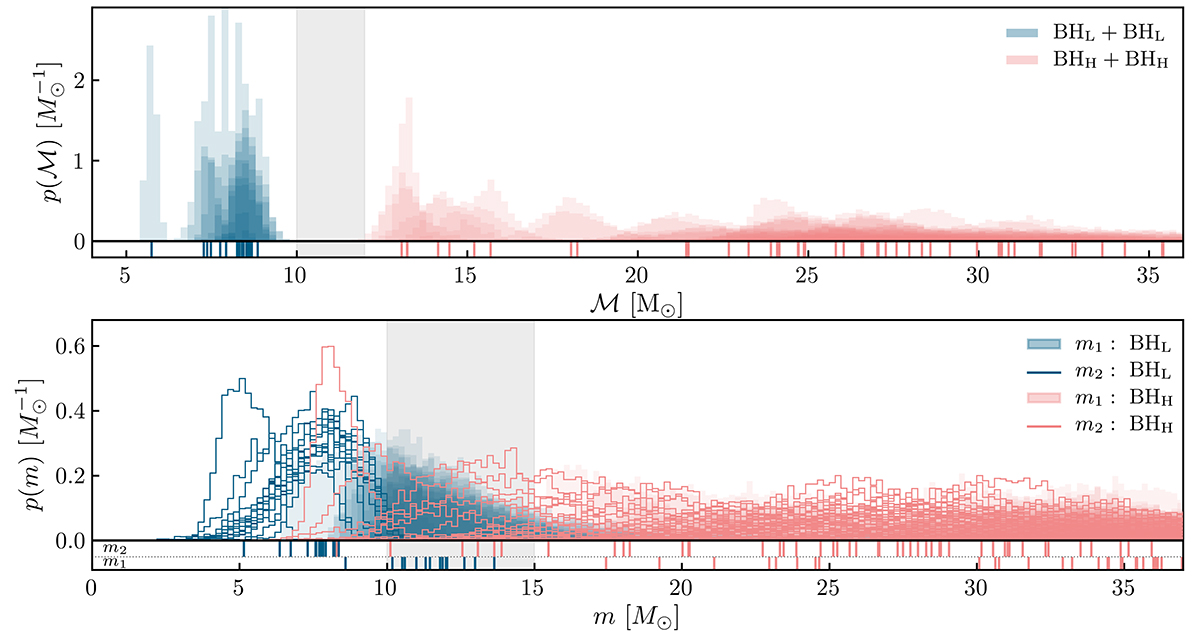
Fig. 1.
Download original image
Events in GWTC-3 with FAR < 1yr−1 sorted according to the chirp-mass peak in which they lie, assuming the Schneider et al. (2023) predictions regarding their classification and the locations of the gaps. Top panel: Chirp-mass posteriors showing the BHL + BHL (blue) and the BHH + BHH (pink). The grey shaded region represents the chirp-mass gap region (ℳ ≈ 10 − 12 M⊙). Bottom panel: Component-mass posteriors showing the BHL (blue) and the BHH (pink) BHs. The grey shaded region represents the expected component-mass gap region (m ≈ 10 − 15 M⊙). The vertical ticks illustrate the median of each posterior.
Current usage metrics show cumulative count of Article Views (full-text article views including HTML views, PDF and ePub downloads, according to the available data) and Abstracts Views on Vision4Press platform.
Data correspond to usage on the plateform after 2015. The current usage metrics is available 48-96 hours after online publication and is updated daily on week days.
Initial download of the metrics may take a while.