Open Access
Fig. 9.
Download original image
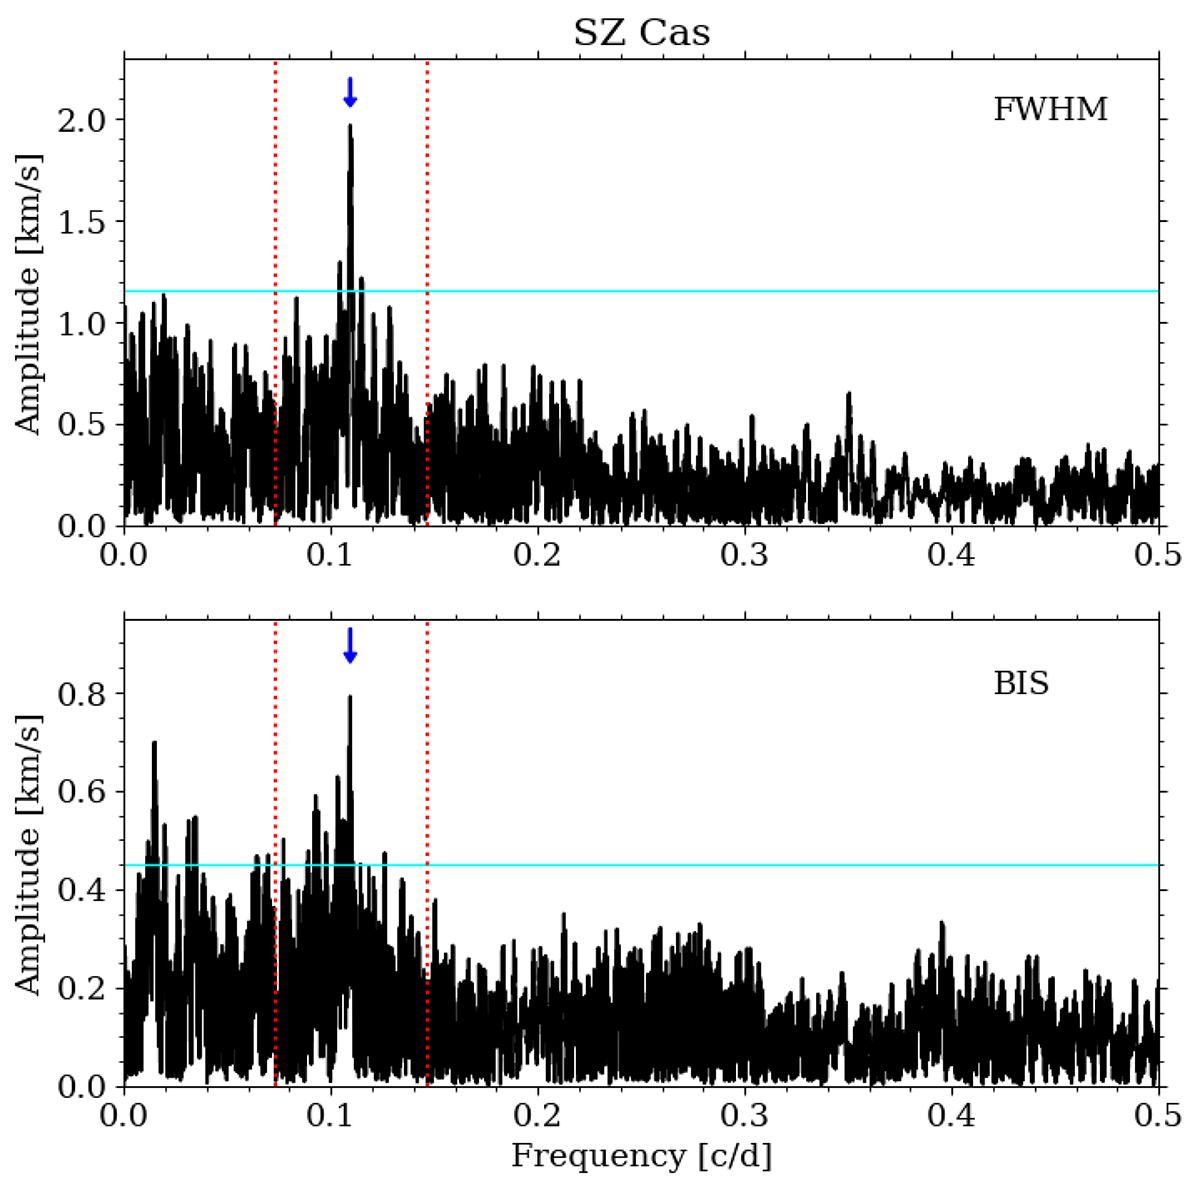
Frequency spectra for SZ Cas after pre-whitening with fundamental mode and its harmonic, whose position is marked with red dotted lines. Additional signal is marked with the blue arrow. Top panel: frequency spectra calculated using FWHM time series. Bottom panel: frequency spectra calculated using BIS time series.
Current usage metrics show cumulative count of Article Views (full-text article views including HTML views, PDF and ePub downloads, according to the available data) and Abstracts Views on Vision4Press platform.
Data correspond to usage on the plateform after 2015. The current usage metrics is available 48-96 hours after online publication and is updated daily on week days.
Initial download of the metrics may take a while.