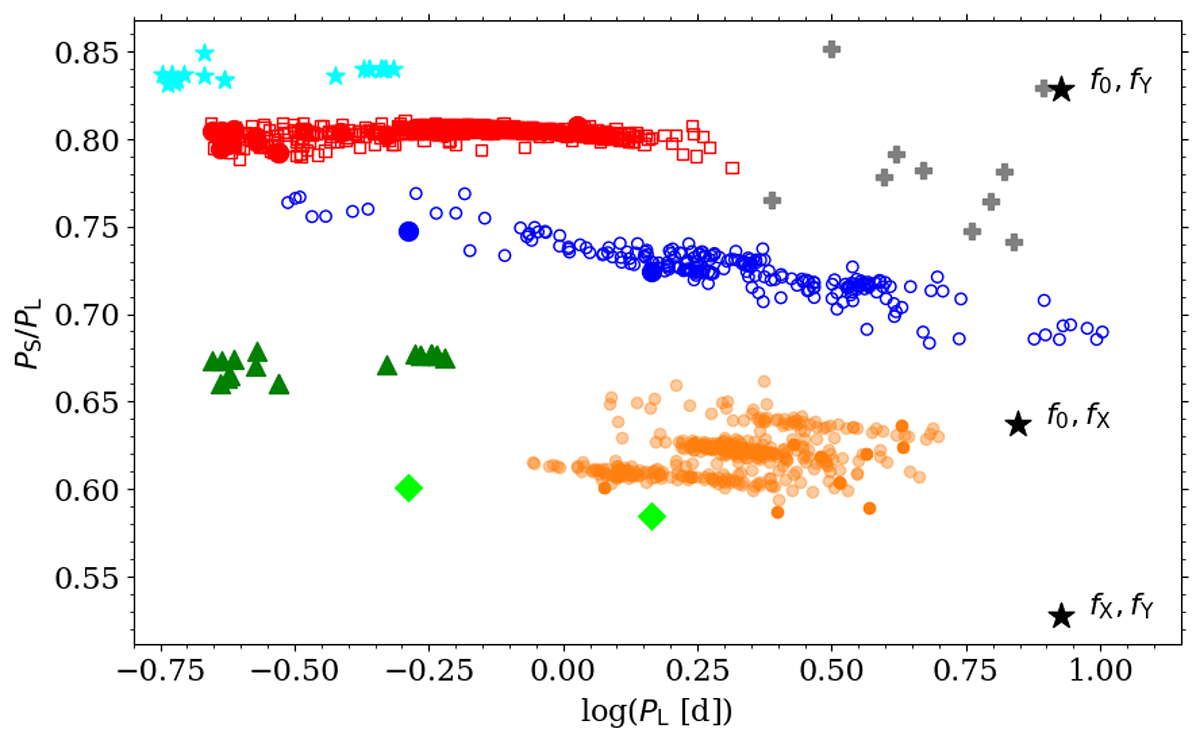
Fig. 8.
Download original image
Petersen diagram for multimode classical Cepheids. Different types of multi-periodicity are plotted with different colors and symbols. Blue circles: Pulsations in fundamental (F) mode and first overtone (1O). Red squares: Pulsations in 1O and second overtone (2O). Cyan asterisks: Pulsation in 2O and third overtone (3O). Green triangles: Pulsations in 1O and 3O. Lime diamonds: Pulsations in F and 2O. Orange points: 0.61 Cepheids. Grey pluses: Subharmonics in 0.61 Cepheids. Data are combined from different sources (see references in Netzel (2023)). Signals detected in X Sgr are plotted with black asterisks and are labeled.
Current usage metrics show cumulative count of Article Views (full-text article views including HTML views, PDF and ePub downloads, according to the available data) and Abstracts Views on Vision4Press platform.
Data correspond to usage on the plateform after 2015. The current usage metrics is available 48-96 hours after online publication and is updated daily on week days.
Initial download of the metrics may take a while.