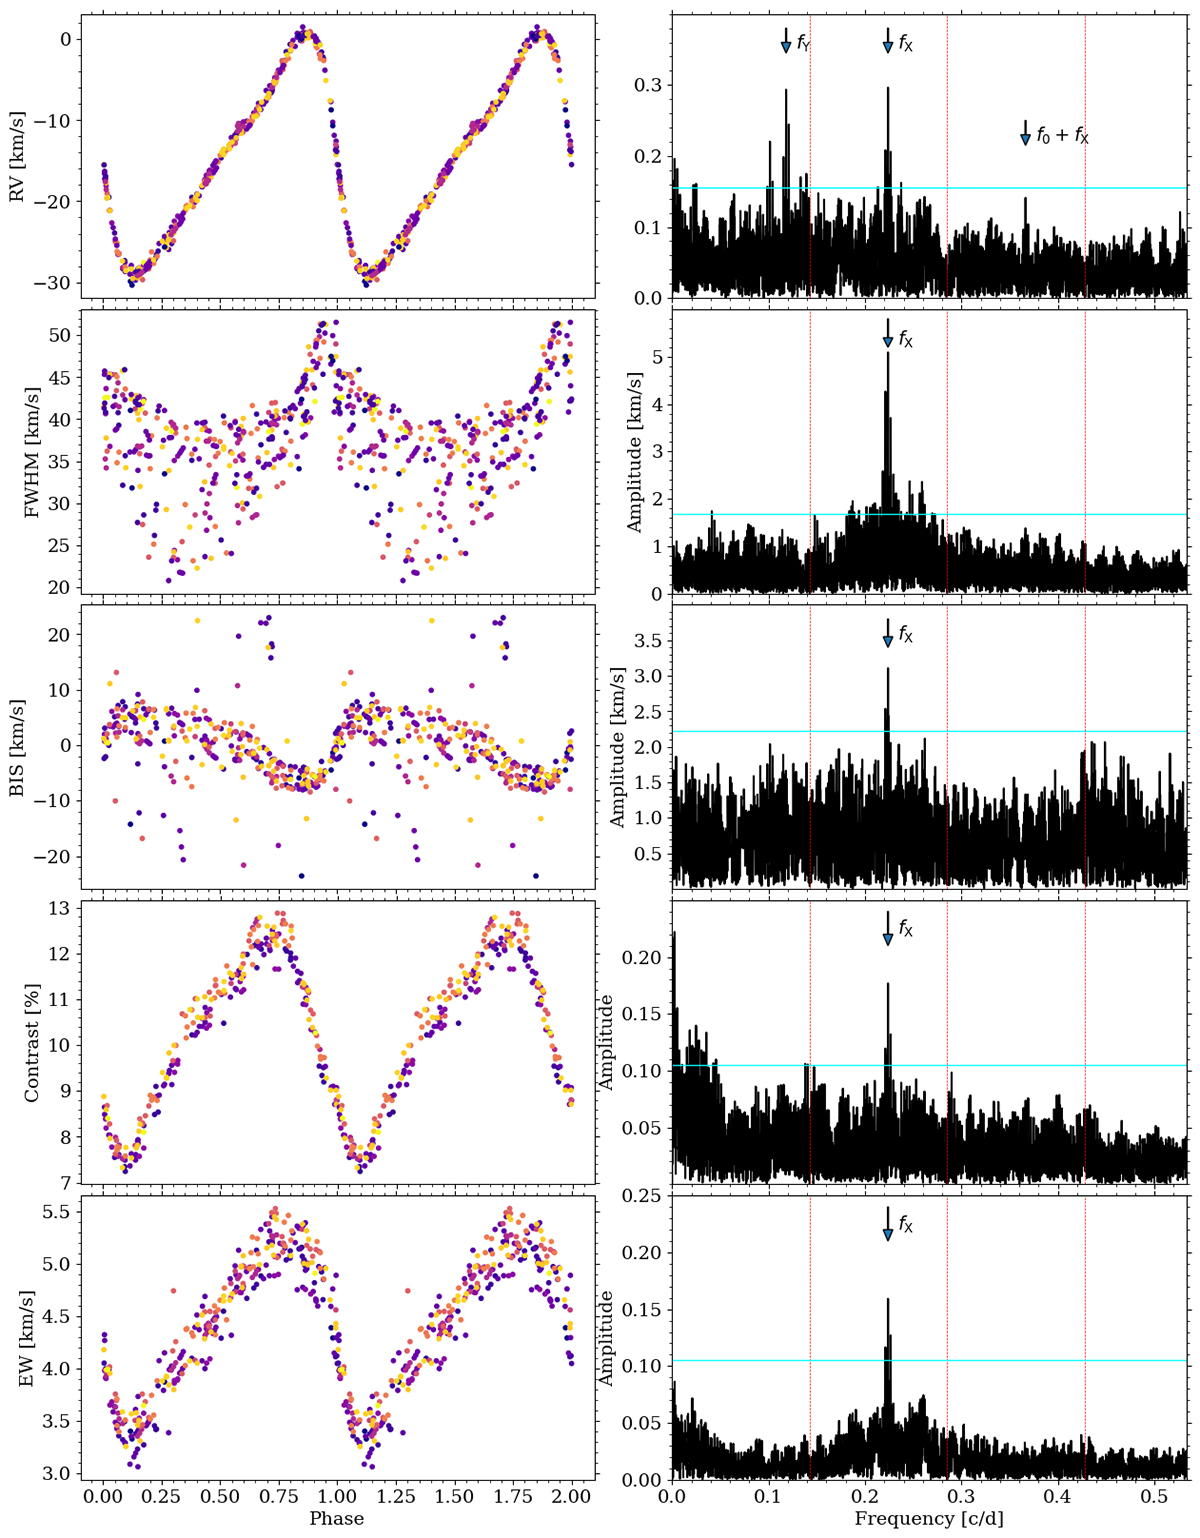
Fig. 7.
Download original image
Phased data and periodograms for X Sgr. Left panel: data for X Sgr phased with the dominant pulsation period. Consecutive rows present data for RV, FWHM, BIS, contrast, and EW. The BJD of each observation is color-coded. Right panel: frequency spectrum after pre-whitening with the dominant pulsation period and its harmonics. The position of the pulsation frequency and its harmonics are marked with red dotted lines. The additional signals are marked with arrows and labels (see also Table 3). The horizontal cyan line corresponds to three times the average noise level.
Current usage metrics show cumulative count of Article Views (full-text article views including HTML views, PDF and ePub downloads, according to the available data) and Abstracts Views on Vision4Press platform.
Data correspond to usage on the plateform after 2015. The current usage metrics is available 48-96 hours after online publication and is updated daily on week days.
Initial download of the metrics may take a while.