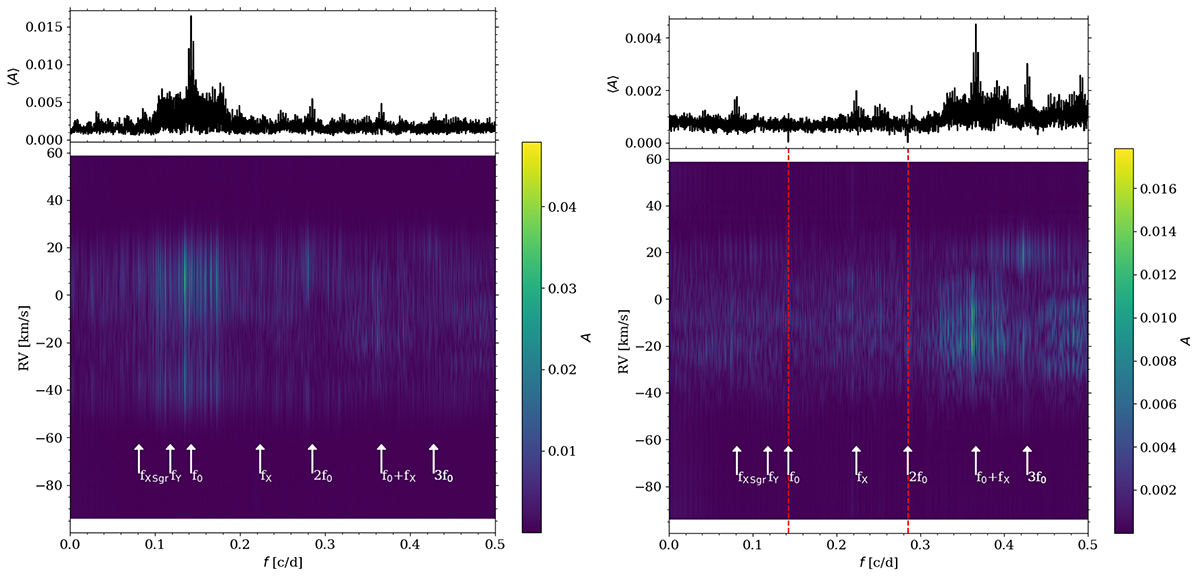
Fig. 13.
Download original image
Fourier spectra in 1D and 2D for X Sgr calculated based on Coralie14 CCFs using FAMIAS software. Left panels: frequency spectra of original data. Right panel: frequency spectra after pre-whitening with fundamental mode and its harmonic. Pre-whitened frequencies are marked in the bottom panel with red lines. Bottom panels: 2D spectra, where amplitude is color-coded. Frequencies found in other methods are marked with white arrows and labeled. Top panels: 1D mean Fourier spectra.
Current usage metrics show cumulative count of Article Views (full-text article views including HTML views, PDF and ePub downloads, according to the available data) and Abstracts Views on Vision4Press platform.
Data correspond to usage on the plateform after 2015. The current usage metrics is available 48-96 hours after online publication and is updated daily on week days.
Initial download of the metrics may take a while.