Open Access
Fig. 12.
Download original image
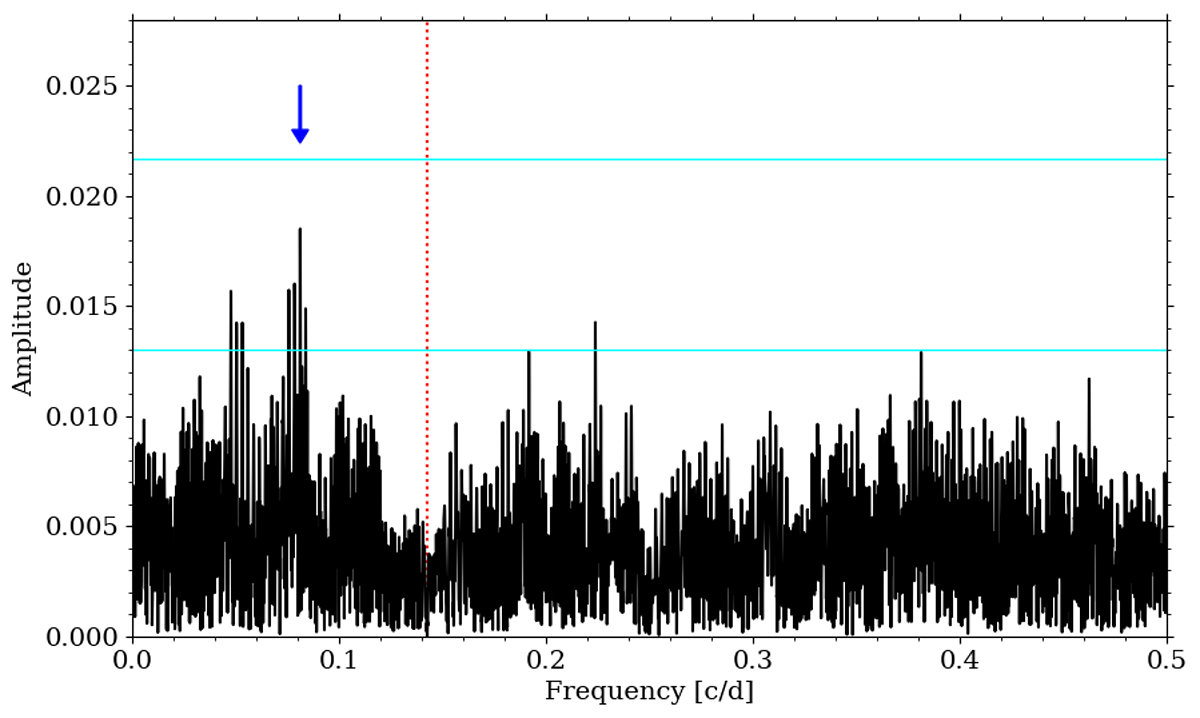
Frequency spectrum of a depth of the bluest Gaussian component (see Fig. 1 and text for details) after pre-whitening with the fundamental mode. Arrows mark the fX Sgr signal. Red dotted lines marks the position of the fundamental mode frequency. Cyan lines correspond to three and five times the average noise level.
Current usage metrics show cumulative count of Article Views (full-text article views including HTML views, PDF and ePub downloads, according to the available data) and Abstracts Views on Vision4Press platform.
Data correspond to usage on the plateform after 2015. The current usage metrics is available 48-96 hours after online publication and is updated daily on week days.
Initial download of the metrics may take a while.