Fig. 9.
Download original image
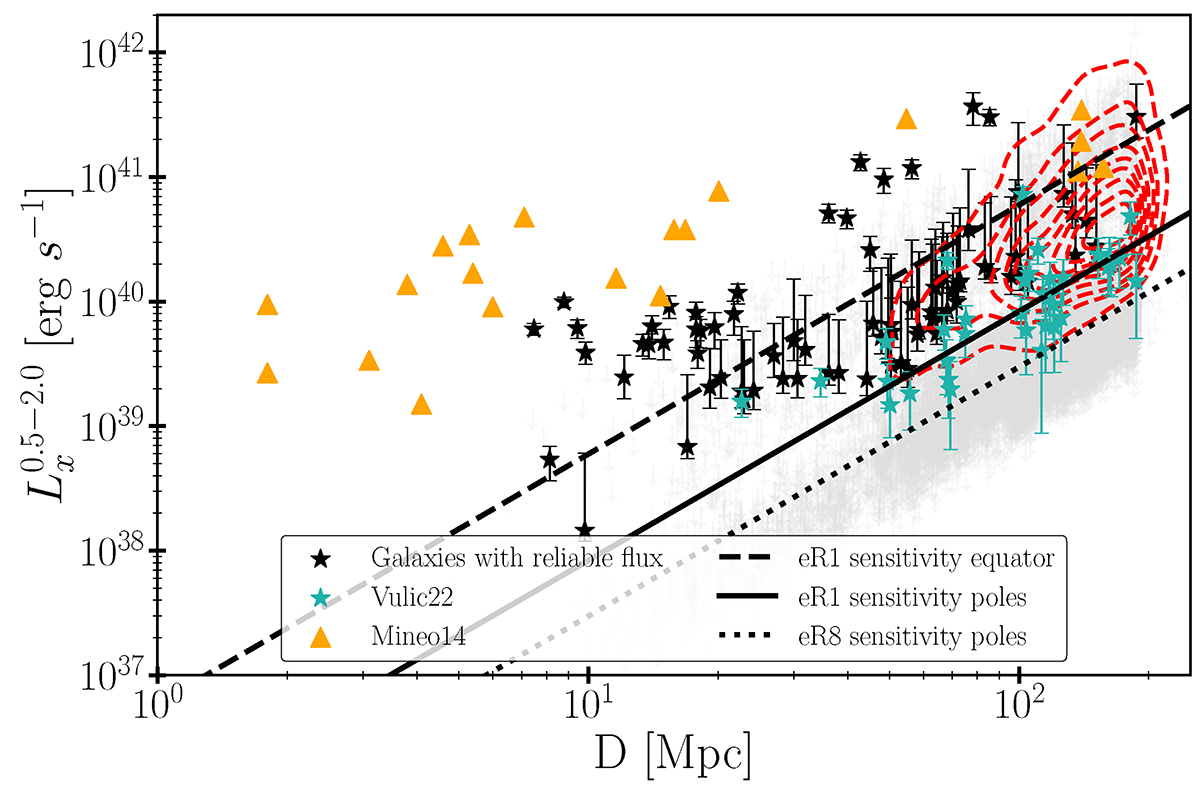
LX versus D for the HEC-eR1 sample of star-forming galaxies. Black stars show the galaxies with reliable flux measurements and lightgray down-arrows, galaxies with uncertain flux measurements. For comparison, we also overplot the normal galaxies from Mineo et al. (2014) and Vulic et al. (2022) as orange triangles and turquoise stars. We also overplot with red contours the galaxy population expected to be observed in the eRASS:8 survey based on the simulation study of Basu-Zych et al. (2020). The dashed and solid lines mark the eRASS1 sensitivity limits at the ecliptic equator and poles respectively. The dotted line indicate the deepest sensitivity of the eROSITA survey which is expected to be reached at the poles of the eRASS:8. These lines are based on the sensitivity values reported in Predehl et al. (2021).
Current usage metrics show cumulative count of Article Views (full-text article views including HTML views, PDF and ePub downloads, according to the available data) and Abstracts Views on Vision4Press platform.
Data correspond to usage on the plateform after 2015. The current usage metrics is available 48-96 hours after online publication and is updated daily on week days.
Initial download of the metrics may take a while.