Fig. 6.
Download original image
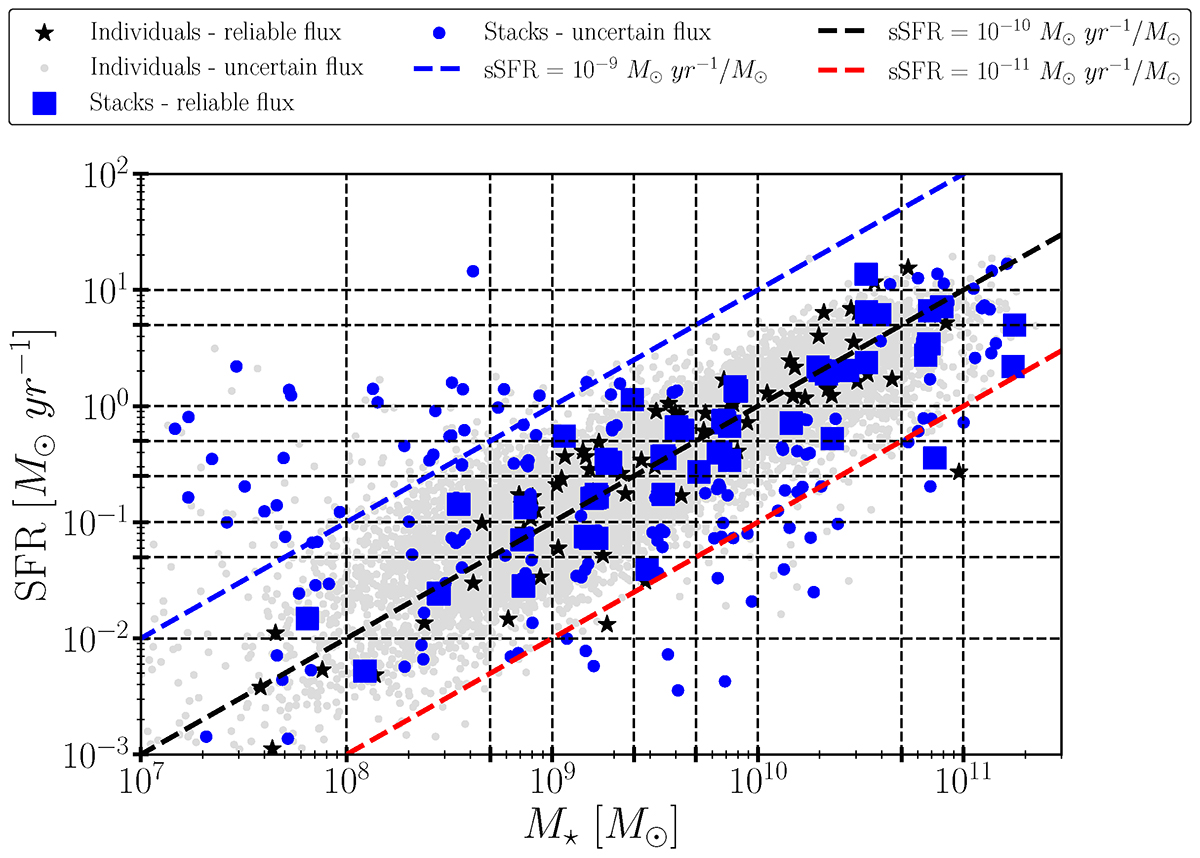
Distribution of SFR-M⋆-D bins on the main sequence plane. Each bin is characterised by the mean SFR and M⋆ of the galaxies contained in each bin. Blue squares correspond to the stacks with reliable X-ray flux measurements based on the X-ray stacking analysis and the blue circles to those with uncertain flux measurements. Black stars show the individual galaxies with reliable X-ray flux measurements and the grey circles the galaxies with uncertain fluxes. The black dashed lines indicate the SFR and M⋆ range of the bins. The diagonal dashed lines indicate three different sSFR values (i.e. sSFR: 10−9, 10−10, and 10−11 M⊙ yr−1/M⊙).
Current usage metrics show cumulative count of Article Views (full-text article views including HTML views, PDF and ePub downloads, according to the available data) and Abstracts Views on Vision4Press platform.
Data correspond to usage on the plateform after 2015. The current usage metrics is available 48-96 hours after online publication and is updated daily on week days.
Initial download of the metrics may take a while.