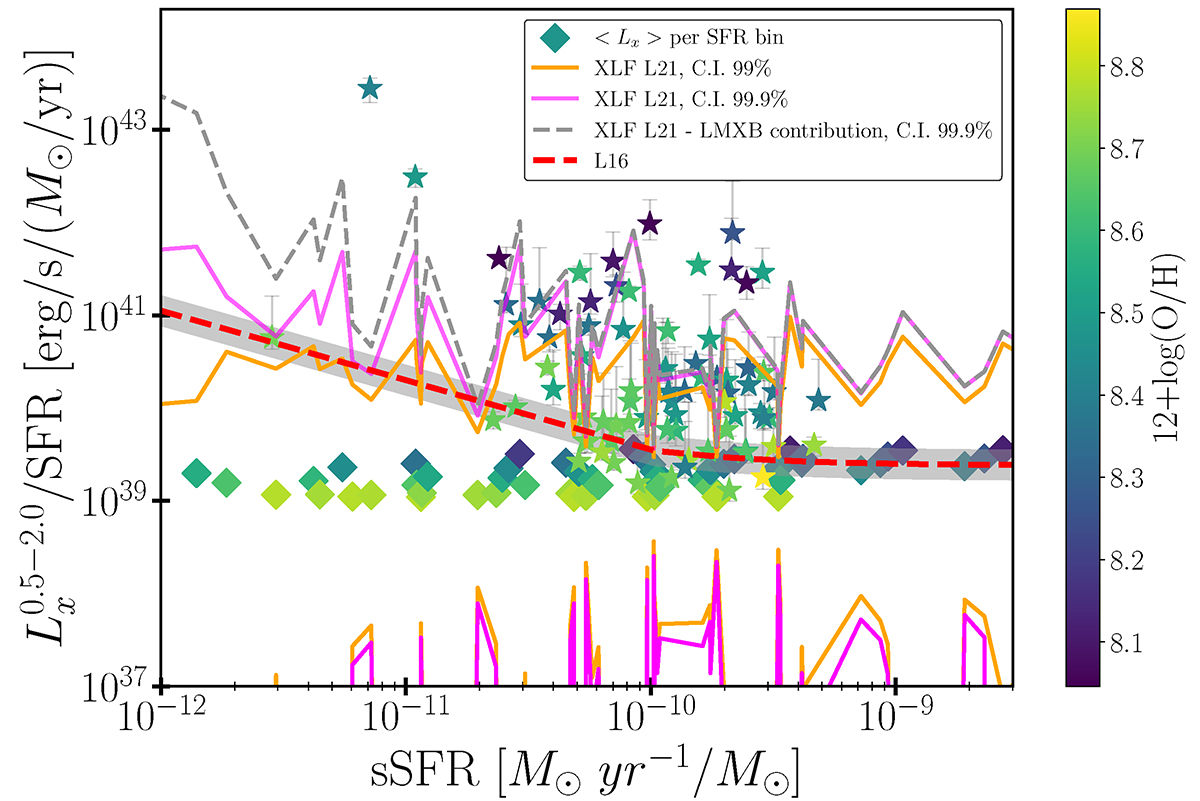
Fig. 20.
Download original image
Total expected LX/SFR distribution due to stochastic sampling of HMXBs XLF as a function of the sSFR. The rhombuses indicate the mean LX/SFR per SFR-M⋆ bin, colour-coded with the gas phase metallicity. The orange and magenta lines correspond to the upper and lower 99%, and 99.9% C.Is. of the HMXBs expected LX/SFR, respectively. Grey dashed line depicts the upper 99.9% C.I of the total expected luminosity accounting for the stochasticity of both, LMXBs and HMXBs. We also overplot with a red line the LX/SFR – sSFR L16 scaling relation, and its corresponding 1σ scatter.
Current usage metrics show cumulative count of Article Views (full-text article views including HTML views, PDF and ePub downloads, according to the available data) and Abstracts Views on Vision4Press platform.
Data correspond to usage on the plateform after 2015. The current usage metrics is available 48-96 hours after online publication and is updated daily on week days.
Initial download of the metrics may take a while.