Fig. 18.
Download original image
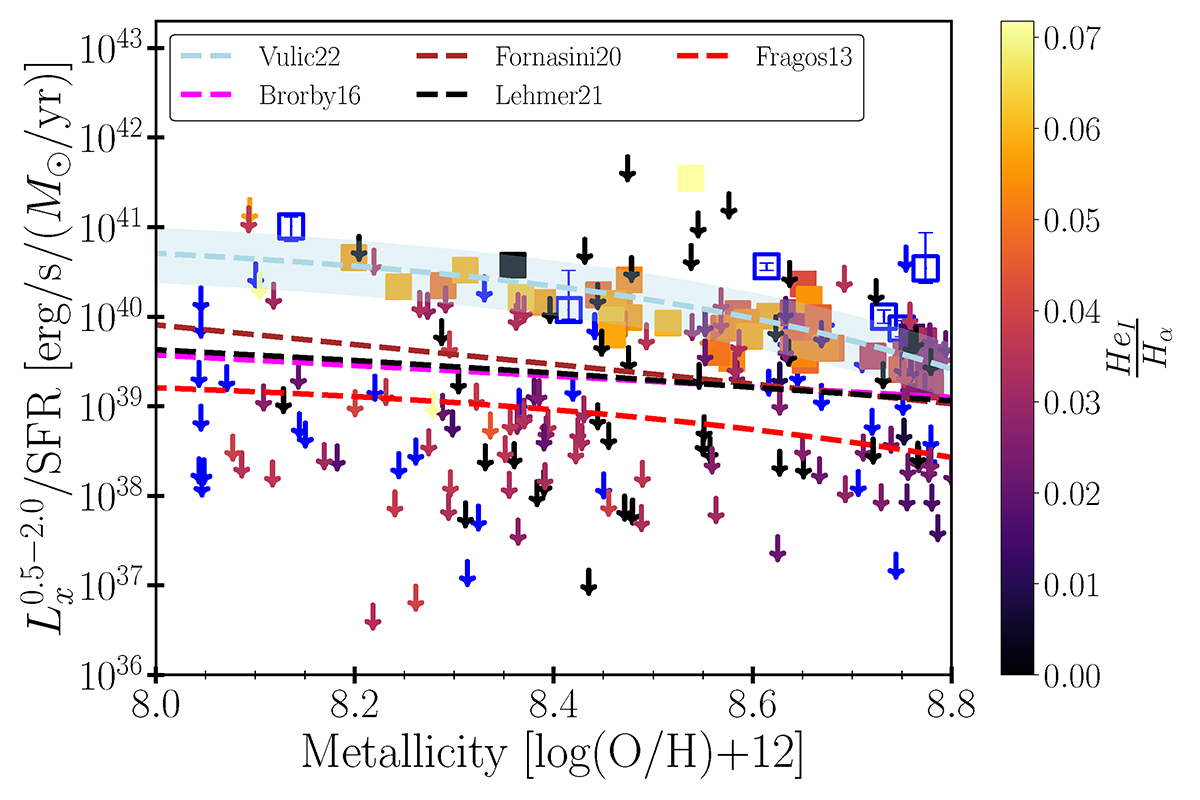
![]() /SFR as a function of galaxy gas-phase metallicity for the SFR-M⋆-D stacks in the colour-coded with the He I/H α ratio. For comparison we overplot the empirical relations from Brorby et al. (2016) (dashed magenta line), Fornasini et al. (2020) (dashed brown line), Lehmer et al. (2021) (dashed black line), and Vulic et al. (2022) (dashed cyan line). The shaded region indicates the 1σ scatter around the latter fit. We also overlay the theoretical prediction from the XRB population synthesis best model from Fragos et al. (2013) (red dashed line).
/SFR as a function of galaxy gas-phase metallicity for the SFR-M⋆-D stacks in the colour-coded with the He I/H α ratio. For comparison we overplot the empirical relations from Brorby et al. (2016) (dashed magenta line), Fornasini et al. (2020) (dashed brown line), Lehmer et al. (2021) (dashed black line), and Vulic et al. (2022) (dashed cyan line). The shaded region indicates the 1σ scatter around the latter fit. We also overlay the theoretical prediction from the XRB population synthesis best model from Fragos et al. (2013) (red dashed line).
Current usage metrics show cumulative count of Article Views (full-text article views including HTML views, PDF and ePub downloads, according to the available data) and Abstracts Views on Vision4Press platform.
Data correspond to usage on the plateform after 2015. The current usage metrics is available 48-96 hours after online publication and is updated daily on week days.
Initial download of the metrics may take a while.