Fig. 14.
Download original image
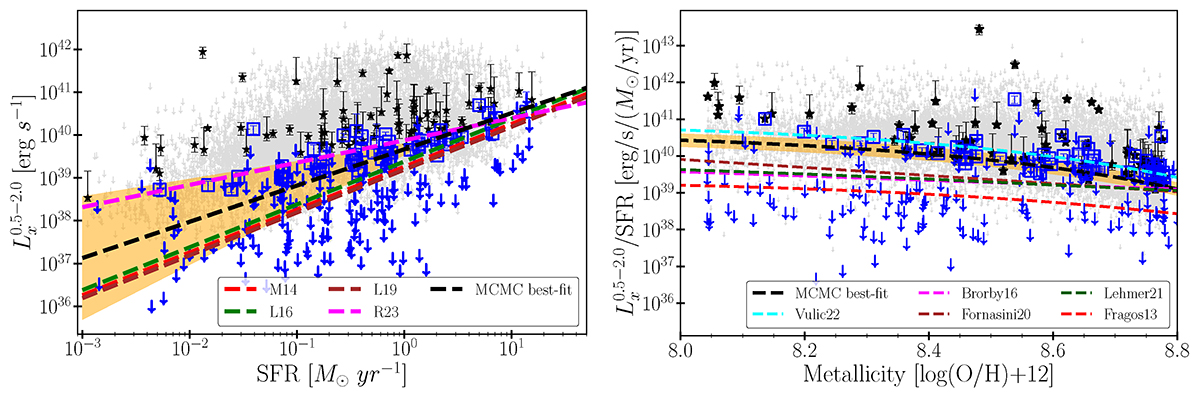
Comparison of our best-fitted scaling relations with the previous works. The left panel shows the distribution of the SFR-M⋆-D stacks in the ![]() -SFR plane. Black stars show the secure star-forming galaxies with reliable flux measurements with their corresponding uncertainties, and the black down-arrows the galaxies with uncertain flux measurements. Our best-fit result is plotted with the black dashed line. The orange shade region indicates the 1σSFR-dependent scatter. Red dashed line depicts the standard scaling relation from Mineo et al. (2014) (M14). The green and brown dashed lines indicate the scaling relations from Lehmer et al. (2016) (L16) and Lehmer et al. (2019) (L19), respectively. Magenta dashed line shows the scaling relation from Riccio et al. (2023). The right panel shows the same distribution in the
-SFR plane. Black stars show the secure star-forming galaxies with reliable flux measurements with their corresponding uncertainties, and the black down-arrows the galaxies with uncertain flux measurements. Our best-fit result is plotted with the black dashed line. The orange shade region indicates the 1σSFR-dependent scatter. Red dashed line depicts the standard scaling relation from Mineo et al. (2014) (M14). The green and brown dashed lines indicate the scaling relations from Lehmer et al. (2016) (L16) and Lehmer et al. (2019) (L19), respectively. Magenta dashed line shows the scaling relation from Riccio et al. (2023). The right panel shows the same distribution in the ![]() /SFR – metallicity plane. Our best fit result is shown again with a dashed black line along with the 1σ scatter (orange shade region). The dashed magenta and brown line shows the best-fit line from Brorby et al. (2016) (B16) and Fornasini et al. (2020) (F20), respectively. In addition, the dashed darkgreen line indicates the best-fit line from Lehmer et al. (2021). Finally, the cyan dashed line, shows the best-fit result from Vulic et al. (2022). We also overlay the theoretical prediction from the XRB population synthesis best model from Fragos et al. (2013) (red dashed line).
/SFR – metallicity plane. Our best fit result is shown again with a dashed black line along with the 1σ scatter (orange shade region). The dashed magenta and brown line shows the best-fit line from Brorby et al. (2016) (B16) and Fornasini et al. (2020) (F20), respectively. In addition, the dashed darkgreen line indicates the best-fit line from Lehmer et al. (2021). Finally, the cyan dashed line, shows the best-fit result from Vulic et al. (2022). We also overlay the theoretical prediction from the XRB population synthesis best model from Fragos et al. (2013) (red dashed line).
Current usage metrics show cumulative count of Article Views (full-text article views including HTML views, PDF and ePub downloads, according to the available data) and Abstracts Views on Vision4Press platform.
Data correspond to usage on the plateform after 2015. The current usage metrics is available 48-96 hours after online publication and is updated daily on week days.
Initial download of the metrics may take a while.