| Issue |
A&A
Volume 694, February 2025
|
|
|---|---|---|
| Article Number | A202 | |
| Number of page(s) | 10 | |
| Section | Astrophysical processes | |
| DOI | https://doi.org/10.1051/0004-6361/202449381 | |
| Published online | 14 February 2025 | |
Possible explanations for the formation of ear-like structures in young Type Ia supernova remnants
1
Department of Astronomy, Key Laboratory of Astroparticle Physics of Yunnan Province, Yunnan University, Kunming 650091, People’s Republic of China
2
Key Laboratory of Statistical Modeling and Data Analysis of Yunnan Province, Yunnan University, Kunming 650091, People’s Republic of China
3
Yunnan University of Chinese Medicine, Kunming 650091, People’s Republic of China
4
Yunnan Observatories, Chinese Academy of Sciences, Kunming 650011, People’s Republic of China
⋆ Corresponding author; This email address is being protected from spambots. You need JavaScript enabled to view it.
Received:
29
January
2024
Accepted:
10
December
2024
Abstract
Several young type Ia supernova remnants (SNRs) exhibit apparent axisymmetrical deviations from spherical symmetry, manifested as two opposite ear-like protrusions in their projected morphologies. The origin of this specific feature remains debated, with several physical mechanisms proposed as possible explanations. In this work, we propose two scenarios to explain the formation of ear-like structures: (i) the feedback of cosmic-ray (CR) acceleration via an effective adiabatic index, γeff, with spatial variations, and (ii) the large-scale pre-existing density gradient in the local interstellar medium (ISM). Our cylindrical hydrodynamic simulation results reveal that both scenarios can produce prominent protrusions well beyond the main shell, resembling the peculiar features observed in several young type Ia SNRs. Additionally, based on the detailed analysis of the simulation data, we attempt to elucidate the ear-formation process and suggest that the relative positions of contact discontinuity can serve as an observational diagnosis in pursuing the origin of ear-like structures. We also discuss the following points: (i) the theoretical prediction of type Ia SNRs with “ears” and the visibility of an ear-like structure in observations; (ii) the simulation-based inference concerning the emission properties of the ear-like regions and the implications of a qualitative comparison of our results with X-ray observations; and (iii) the potential combination of different scenarios. Despite various existing models, we tend to regard our proposed scenarios as potential alternatives, whereby the ear-like structures originate in pure ejecta-ISM interaction, distinct from the ejecta-circumstellar medium (CSM) or jet-CSM models.
Key words: shock waves / methods: numerical / ISM: supernova remnants
© The Authors 2025
 Open Access article, published by EDP Sciences, under the terms of the Creative Commons Attribution License (https://creativecommons.org/licenses/by/4.0), which permits unrestricted use, distribution, and reproduction in any medium, provided the original work is properly cited.
This article is published in open access under the Subscribe to Open model. This email address is being protected from spambots. You need JavaScript enabled to view it. to support open access publication.
1. Introduction
Supernova remnants (SNRs) are highly important celestial objects, as they are believed to be one of the major acceleration sites of Galactic cosmic rays; on the other hand, they are linked to several fundamental astrophysical issues (see, e.g., Blasi 2013; Amato 2014; Gabici et al. 2019, for recent reviews). With impressive efforts having been undertaken both on the observational and theoretical sides, our understanding of SNRs has been substantially improved in terms of the radiation processes and shock physics (see, e.g., Reynolds 2008; Vink 2012; Marcowith et al. 2020, for recent reviews). Despite sustained progress witnessed over the last few decades, a complete physical picture of SNRs has yet to merge. The reason for making such a claim is two-fold: on the one hand, the underlying microphysics relevant to the dynamical evolution of a SNR, as well as the nonlinear diffusive shock acceleration (NLDSA), is not fully understood; on the other hand, when confronted with updated multi-band data and observed morphological properties, theoretical models often fail to work, unless some ad hoc modifications and assumptions are invoked.
Modern astronomical facilities, with an enhanced level of sensitivity and resolution, have revealed a bewildering array of morphologies concerning SNRs in different bands. As SNRs are the products of interactions between the expanding ejecta and the surrounding interstellar medium (ISM), these observed morphological features may contain vital information regarding the structure and composition of both the stellar ejecta and ambient medium. Hence, the rich variety of SNR morphologies merits a detailed study. For example, in radio and X-ray bands, some SNRs are characterized by two symmetrically opposite ear-like protrusions at the periphery of the remnant (see Fig. 1 for three representative cases of type Ia SNRs). These peculiar protrusions (termed “ear-like” structures) are observed in almost all types of SNRs, while the actual origin of this peculiar feature is still under investigation.
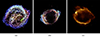 |
Fig. 1. Chandra X-ray images of three type Ia SNRs with evident ear-like structures in opposite directions. Panel (a): Kepler’s SNR(Reynolds et al. 2007). Panel (b): SNR G1.9+0.3 (Borkowski et al. 2013). Panel (c): SNR G299.2-2.9 (Park et al. 2007). |
Considerable research efforts have been devoted to seeking possible explanations for the formation of ear-like structures and several scenarios have been proposed in the literature. Some of these works suggest that the ear-like structures are the results of two opposite jets from a central region (Soker 2022). More specifically, the jets interact with the circumstellar medium (CSM) and push it outward in opposite directions, yielding the formation of ear-like structures. Such a jet-CSM interaction model is introduced to decipher the observed morphologies of several SNRs (Murata & Shibazaki 1996; Gaensler et al. 1998; Velázquez & Raga 2000; Castelletti et al. 2006; Zavala et al. 2008; Yu & Fang 2018) and being carefully studied in detail (Soker 2010; Tsebrenko & Soker 2013; Grichener & Soker 2017; Akashi & Soker 2021). This specific scenario is particularly appealing for core-collapse SNRs, as the invoked jets could be launched by the compact object at the explosion center in some circumstances.
Besides the jet-CSM interaction model, several authors have proposed an alternative scenario to account for the formation of ear-like structures (Blondin et al. 1996). The core idea of this specific hypothesis is that the CSM is seriously modified by the progenitor system’s stellar wind, forming a special CSM structure. As a consequence, when the supernova explodes, the expanding ejecta interacts with the modified CSM, leading to the formation of ear-like structures (Ustamujic et al. 2021; Chiotellis et al. 2021; Velázquez et al. 2023). This ejecta-CSM scenario is favored in interpreting the ear-like structures observed in type Ia SNRs, as in most type Ia supernovae (SNe Ia), the progenitor star is completely destroyed and thus incapable of launching the desired jets (Livio & Mazzali 2018). Both jet-CSM and ejecta-CSM models are in fact derived from various SNe channels. Moreover, the topics pertaining to the formation of ear-like structures are expanded upon in several other scenarios: SNe Ia inside the planetary nebulae (Tsebrenko & Soker 2013, 2015a,b); the intrinsical ejecta anisotropy in the density and/or velocity distribution (Wang & Chevalier 2001; Tsebrenko & Soker 2015c; Orlando et al. 2016; Tutone et al. 2020).
Regarding the observations of young type Ia SNRs, the ear-like structures are observed in several cases: Kepler’s SNR (Reynolds et al. 2007), SNR G1.9+0.3 (Borkowski et al. 2013), and SNR G299.2−2.9 (Park et al. 2007). For the three mentioned characteristic cases, as the follow-up observations provide some clues on the potential asymmetric explosion and/or interactions with the structured ambient medium, it seems quite reasonable to apply the jet-CSM or ejecta-CSM scenarios as possible explanations for the formation of ear-like structures (Tsebrenko & Soker 2013; Chiotellis et al. 2020). However, apart from the aforementioned scenarios, several factors, proven to have a profound impact on the dynamical evolution of a SNR in literature, are scarcely considered in interpreting the formation of ear-like structures. These factors, inferred from the observations of young type Ia SNRs, mainly include ISM density gradient and discontinuity (Safi-Harb et al. 2005; Park et al. 2007; Blair et al. 2007; Gomez et al. 2012; Williams et al. 2012; Borkowski et al. 2014; Sano et al. 2017; Petruk et al. 2024), as well as the feedback of CR acceleration processes (Warren et al. 2005; Cassam-Chenaï et al. 2007, 2008; Miceli et al. 2009). Thus, it is imperative to assess the potential impact of these unconsidered factors on shaping ear-like structures.
To this end, we tentatively propose two alternative scenarios as possible explanations for the formation of ear-like structures observed in young type Ia SNRs: (i) the feedback of CR acceleration via effective adiabatic index, γeff, with spatial variations, and (ii) the large-scale pre-existing density gradient in the local ISM. We attempt to address how the formation of ear-like structures depends on the two prior ingredients. In addition, we trace the relative positions of the contact discontinuity (referring to the ratio of the forward shock radius to the contact discontinuity), serving as useful diagnostics.
The sketch of this work is as follows. A detailed description of our paradigm and initial setup of simulations are in Sect. 2. The simulation results are presented in Sect. 3. In Sect. 4, we summarize our findings and offer a brief discussion.
2. Model descriptions
2.1. HD equations
We simulated the dynamical evolution of our benchmark type Ia SNR with the time-dependent HD equations of mass, momentum, and energy conservation:
 (1)
(1)
 (2)
(2)
![Mathematical equation: $$ \begin{aligned}&\frac{\partial E}{\partial t}+\nabla \cdot \left[ (E+P) \boldsymbol{u}\right] =0, \end{aligned} $$](/articles/aa/full_html/2025/02/aa49381-24/aa49381-24-eq3.gif) (3)
(3)
where ρ, u and P are mass density, fluid velocity, and thermal pressure, respectively. Also, E is the total energy density:
 (4)
(4)
Here, the effective adiabatic index γeff is adopted to mimic the back reaction of accelerated particles, with a typical value of less than 5/3 (Blondin & Ellison 2001; Frashcetti et al. 2010; Orlando et al. 2012; Warren & Blondin 2013). For an elaborate model coupled with the non-linear shock acceleration(Decourchelle et al. 2000; Ferrand et al. 2010; Pavlović 2017; Peng et al. 2020), the index γeff becomes time- and/or space-dependent. In this work, the PLUTO code developed by Mignone et al. (2007, 2012) is adopted to perform our simulations and the HD equations are tackled with a cell-centered finite-volume scheme with high-order Godunov methods. Besides, radiative cooling is not considered here as the benchmark SNR is in its adiabatic evolutionary stage during the whole simulation.
2.2. Simulation setup
We performed a series of hydrodynamic simulations in the (r, z) plane with cylindrical symmetry and 1024 × 2048 uniform grids, covering a domain of (0, 8.5) × (−8.5, 8.5) pc except for Model B in the density gradient scenario. 1 A supernova shock is driven via injecting mass and kinetic energy in a small circular region at the domain center, thus making the remnant have an initial volume. In this work, we adopt the exponential profile proposed by Dwarkadas & Chevalier (1998) as the initial set-up of our benchmark type Ia SNR:
 (5)
(5)
 (6)
(6)
 (7)
(7)
Here, A and ve are constants whose values depend on the mass and kinetic energy of the ejecta while t is the time since the SN explosion. We set appropriate parameters for the initialization of a typical type Ia SNR: ejecta mass, Mej = 1.4 M⊙, ejecta kinetic energy, Eej = 1.0 × 1051 erg, initial radius of the ejecta, Rej = 0.5 pc (corresponding to an initial age of about 20 years), and the background temperature, T0 = 104 K. Throughout the work, the mass density is in units of mH cm−3 and the logarithm is taken for better visualization.
2.3. Configurations of the two proposed scenarios
As mentioned above, we put forward two alternative scenarios as potential interpretations for the formation of ear-like structures observed in young type Ia SNRs, and attempt to address how the formation of ear-like structures depends on the two proposed prescriptions. In this section, we shall elaborate on the configurations of each scenario in detail. A physical justification as well as a discussion regarding the proposed scenarios will be given in Sect. 4.
2.3.1. Spatial variations of the effective adiabatic index γeff
The effective adiabatic index γeff, regarded as an indicator of efficient CR acceleration, is adopted here to mimic the feedback of the accelerated particles. Concerning the recent observations of several young type Ia SNRs, it has been reported that the inferred acceleration efficiency is variable around the shock periphery (Cassam-Chenaï et al. 2008; Hovey et al. 2018; Tsuji et al. 2021; Reynolds et al. 2021; Sapienza et al. 2022), implying a spatially dependent CR acceleration. In principle, the azimuthal variations of acceleration efficiency could be attributed to several factors: orientation of the local magnetic field with respect to the shock front (shock obliquity), shock velocity, upstream neutral fraction, or other complex plasma physics processes (Reynolds et al. 2021). Here, our spatially dependent γeff profile is given by:
 (8)
(8)
Specifically, the parameter a (in units of pc) divides the simulation domain into two parts: the inefficient acceleration region with γeff = 5/3 and the efficient acceleration region with γeff ≤ 5/3. Here, γeff is applied only to the post-shocked ISM region. Additionally, the expanding ejecta and the unperturbed ISM are characterized by γ = 5/3. For our benchmark case here, we tentatively set a = 2.0 pc and the ambient medium is uniform with a constant number density n0 = 0.1 cm−3.
2.3.2. Large-scale density gradients in the local ISM
Density gradients in the local ambient medium are inferred from the observations of several young type Ia SNRs and frequently invoked to explain the observed morphologies and emission properties (Hnatyk & Petruk 1999; Petruk 1999; Patnaude et al. 2012; Post et al. 2014; Lu et al. 2021). For our benchmark case here, two models (Model A and Model B) are set up for a tentative investigation and their specific configurations are listed in Table 1. Specifically, nmax stands for the maximum ISM number density, while nmin denotes the minimum ISM number density. Here, we set nmax = 0.3 cm−3 and nmin = 0.03 cm−3. Our benchmark SNR here is evolving inside the simulation domain with a large-scale density gradient along the z-axis, which signifies n(r, z) = n(|z|) with |∂n/∂z| = 0.0318 cm−3/pc. Regarding Model A, the number density of the ambient medium decreases continuously from z = 0 to z = ±zmax, with zmax set as 8.5 pc. As for Model B, the ISM number density increases continuously from z = 0 to z = ±zmax.
Parameters for the density gradient scenario: zmax = 8.5 pc, the ISM number density nmax = 0.3 cm−3, and nmin = 0.03 cm−3.
3. Results
In this section, we present the simulation results of our benchmark type Ia SNR propagating into specific background environments. Then we assess the potential contributions of the two proposed prescriptions to shaping the ear-like structures.
3.1. Simulation results of the spatially dependent γeff scenario
Figure 2 displays the density distributions of our benchmark SNR at 1000 years. Panels a–d illustrate the results with different γeff characterizing the efficient acceleration region, where γeff = 5/3, 4/3, 6/5, 1.1 are adopted, respectively. As shown in the plots, the two-shock structures are evident in all cases: a forward shock (FS) compressing the background ISM, while a reverse shock (RS) moving inward relative to the expanding ejecta in a Lagrangian sense. Inside the intershock region bordered by the FS and RS, the shocked ISM encounters the shocked ejecta at the contact discontinuity (CD), an interface that is subject to Rayleigh-Taylor instability (RTI) (Zhou 2017a,b). The finger-like structures develop in the RTI unstable region as the shocked ejecta permeates into the shocked ISM.
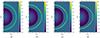 |
Fig. 2. Density profiles of our benchmark type Ia SNR at 1000 years. Panels a–d illustrate the results for γeff = 5/3, 4/3, 6/5, 1.1, respectively. The color bars show the logarithm of density in units of mH cm−3. |
Concerning panel a, since there are no spatial variations of the adiabatic index inside the simulation domain (γeff = 5/3), the outline of the SNR manifests a roughly circular shape and there are no evident morphological changes along the periphery. This specific case could serve as a validation test for our scenario and its result is consistent with the previous studies (Jun & Norman 1996; Dwarkadas 2000). Panels b–d illustrate the results with γeff < 5/3 characterizing the efficient acceleration region (|z|> a). As displayed, an evident ear-like structure is seen in the equatorial region of the remnant for all three cases, resembling the shape of SNR G1.9+0.3. The ear-like structure here is characterized by a local arched bulge with a central angle ∼40°, protruding well beyond the main forward shock. The width of the arched bulge is ∼4 pc along the z-axis, comparable with the extent of the pre-set inefficient acceleration region (|z|< a, 4 pc).
To elucidate the formation process of the ear-like structures seen in Fig. 2, we analyze the output data and illustrate the results in Fig. 3. Specifically, panels (a)–(d) depict the temporal evolution of the forward shock with different γeff, where the RX curves represent the averaged shock radius with a specific azimuthal angle X (0,45,90 deg, with regard to the r-axis). In panel a, due to no spatial variations in the adiabatic index, the radii of the FS in different azimuthal directions are roughly equivalent, yielding an overlap of the three RX curves. Consequently, the periphery of the benchmark SNR is nearly circular and no ear-like structures turn up.
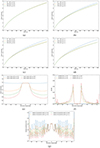 |
Fig. 3. Extracted results from output data elucidating the formation process of ear-like structures. Panels (a)–(d): temporal evolution of the forward shock with different γeff, where RX curves represent the averaged shock radius with a specific azimuthal angle X(0,45,90 deg; with regard to the r-axis). Panel (e): azimuthal distribution of the forward shock radius at 1000 years with different γeff. Panel (f): derivative of shock radius with respect to the azimuthal angle at 1000 years with different γeff, with its absolute value being plotted. Panel (g): relative positions of contact discontinuity (the ratio of the forward shock radius to the contact discontinuity) at 1000 years with different γeff values. |
For panels b–d, we set γeff = 5/3 and γeff < 5/3 to characterise the inefficient acceleration region (|z|< a) and the efficient acceleration region (|z|> a), respectively. As illustrated, at an early stage (< ∼ 120 years), since the entire SNR evolves in the pre-set inefficient acceleration region, the three RX curves overlap with each other. Then, as time proceeds, the R90 and R45 curves undergo a gradual bend due to part of the FS progressively entering the region with γeff < 5/3. As expected, when compared with the case of γeff = 5/3, a lower γeff causes the FS to expand slightly slower, leading to the shrinking of the intershock region (Blondin & Ellison 2001). Regarding the R0 curves, they share an identical track with their counterpart in panel a in that part of the FS, which is permanently propagated within the region with γeff = 5/3 (|z|< a). The above difference between the radii of the FS in different azimuthal directions accumulates as the SNR expands, resulting in the formation of ear-like structures.
Panel e in Fig. 3 presents the azimuthal distribution of the FS radius at 1000 years with different γeff. As shown in the plot, for γeff = 5/3, the averaged FS radius is about 7.56 pc, along with slight azimuthal variations. In cases with γeff < 5/3, the azimuthal distributions outline the gross features of the ear-like structures. More specifically, the overlapping part characterizes the extent of the ear-like region, while the sharp decline on either side describes the gap between the ear-like region and the main FS. This specific gap can also be delineated by the derivative of shock radius with respect to the azimuthal angle (i.e., panel f), which depicts the changing rate of the sharp decline as peak-like structures. Regarding panel f, the arched ear-like protrusion manifests itself in a central plateau region with two peak-like structures aside, where the plateau region characterizes the outermost periphery of the arched bulge, while the peak-like structure represents the gap between the ear-like region and the main FS. By combining panels e and f, it is apparent that a lower γeff results in a more distinct ear-like structure.
As reported in the literature, the relative positions of contact discontinuity, defined as the ratio of the forward shock radius to the contact discontinuity, could serve as a practical probe tracing cosmic ray acceleration at SNRs (Decourchelle et al. 2000; Blondin & Ellison 2001; Warren et al. 2005; Cassam-Chenaï et al. 2007, 2008). In panel g, we plot the derived profiles of the relative positions of CD at 1000 years with different γeff values. As is clearly depicted, within the ear-like region (from ∼ − 20° to ∼ + 20°), all four cases exhibit a near-identical distribution. However, outside the ear-like region, it is clear that a lower γeff value leads to a reduced FS/CD ratio. To see such a difference among the above results is not surprising and this could be primarily ascribed to the γeff value adopted here. More explicitly, when a lower γeff is at applied, it will give rise to a shrinking intershock region, where the forward shock approaches the contact discontinuity, thus reducing the FS/CD ratio.
It is worth mentioning that the development of the Rayleigh-Taylor instability does not seem to be prominently affected by γeff in our simulations (see Fig. 2). This is because we set γ = 5/3 for the ejecta, namely, only the forward shock acceleration is considered here (Ferrand et al. 2010; Frashcetti et al. 2010). Hence, concerning our derived results, the reduction of the FS/CD ratio here could be solely attributed to the variations of the forward shock radius. Moreover, if efficient particle acceleration at both shocks is favored, a narrower intershock region with sharper, denser finger-like structures would be expected (Blondin & Ellison 2001; Wang 2011; Warren & Blondin 2013).
3.2. Simulation results of the density gradient scenario
In Fig. 4, panels a–b illustrate the density distributions of the benchmark SNR at 1000 years. Concerning the density gradient scenario, two different models are set up with their specific configurations being listed in Table 1. As displayed in the plots, a distinct ear-like structure appears as a triangular protrusion at the equator of the remnant in panel b as in Model B. We note that the ear-like structure is located within the low-density region and its triangular shape resembles the appearance of Kepler’s SNR and SNR G299.2−2.9.
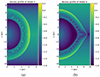 |
Fig. 4. Density profiles of our benchmark type Ia SNR at 1000 years. Panels (a)–(b) illustrate the results for Models A and B, respectively. The color bars show the logarithm of density in units of mH cm−3. |
To interpret the formation mechanism of the ear-like structure shown in Fig. 4, we analyzed the output data and we display the results in Fig. 5. Specifically, panels a–b illustrate the temporal evolution of the forward shock for Models A and B, respectively, where the RX curves represent the averaged shock radius with a specific azimuthal angle X (0,45,90 degrees, with regard to the r-axis). As depicted in panel b, since the SNR evolves in the pre-set density gradient, the three RX curves start to bifurcate at an early stage (< ∼ 40 years). It is obvious that a specific part of the shell tends to retain itself in the low-density region, while the remaining part experiences more of the density gradient (with a gradually increasing density) as the SNR expands. Such a difference manifests itself in the expanding radius of the FS with different azimuthal angles and accumulates as time proceeds (see panel c for the azimuthal distribution of the FS radius at 1000 years), yielding the formation of an ear-like structure in the low-density region.
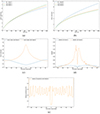 |
Fig. 5. Extracted results from output data elucidating the formation process of ear-like structures. Panels (a)–(b): temporal evolution of the forward shock for Models A and B, respectively, where RX curves represent the averaged shock radius with a specific azimuthal angle X(0,45,90 deg; with regard to the r-axis). Panel (c): azimuthal distribution of the forward shock radius at 1000 years for Models A and B. Panel (d): derivative of shock radius with respect to the azimuthal angle at 1000 years for Models A and B, with its absolute value being plotted. Panel (e): relative positions of contact discontinuity (the ratio of the forward shock radius to the contact discontinuity) at 1000 years for Model B. |
In the case of Model A, the resulting SNR exhibits a roughly round shape with a slight elongation toward the low-density region. Despite the accumulative bifurcation between three RX curves, no clear ear-like structures appear. This could be explained by panel d in Fig. 5, where the derivative of the shock radius with respect to the azimuthal angle at 1000 years is depicted. Specifically, regarding Model B, the produced triangular protrusion manifests itself in two close peak-like structures characterizing the periphery. As for Model A, no prominent peak-like structures appear, implying that the azimuthal variations of the FS radius are relatively moderate, incapable of shaping such peculiar protrusions.
In panel e, we depict the derived profiles of the relative positions of CD at 1000 years for Model B, where the ear-like structure is well formed. As is clearly shown, a reduced FS/CD ratio is obtained within the core ear-like region. This is primarily due to the extending of the Rayleigh–Taylor finger (close to the remnant outer rim). More explicitly, since part of our benchmark SNR evolves in the low-density region, the post-shock pressure here experiences a substantial drop (compared with its neighboring counterpart), which leads to a pressure gradient in the azimuthal direction. Such an angular pressure gradient would drive an additional component of the shocked gas velocity toward the low-density region (Dohm-Palmer & Jones 1996; Chiotellis et al. 2021). As a consequence, the Rayleigh–Taylor finger there is capable of retaining its radial structure and growing further, which contributes to reducing the local FS/CD ratio.
When compared with the results of the spatially dependent γeff scenario (i.e., panel g of Fig. 3), it is apparent that there is a distinct difference between the two proposed scenarios concerning the FS/CD ratio within the core ear-like region. For the case of a spatially dependent γeff scenario, the FS/CD ratio in the core ear-like region is generally higher than that in other regions. While for the density gradient scenario, a reduced FS/CD ratio is obtained within the core ear-like region, lower than that of the remaining part. Such a result is actually a manifestation of the different physical mechanisms accounting for the formation of ear-like structures. More specifically, the arched bulges shown in Fig. 2 are principally due to the “shrinking” effect in the efficient acceleration region with γeff < 5/3, while the triangular protrusion depicted in Fig. 4 mainly results from the propagation of a specific portion of the SNR in the low-density region.
As mentioned before, several novel scenarios have already been put forward as endeavors to decipher the formation process of ear-like structures observed in SNRs, where the primary focus is to look for feasible physical scenarios to reproduce the peculiar protrusions resembling the X-ray observables. However, despite the clearly formed ear-like bulges in various prescriptions, the imprint left by specific scenarios on the structure and morphology of the resulting SNRs has received little attention. Such an imprint, in principle, could serve as a useful observational diagnostic in discriminating between the many physical mechanisms responsible for the formation of ear-like structures. For example, the FS/CD ratio over the entire remnant could be derived from the detailed analysis of the broadband X-ray emission (Warren et al. 2005; Miceli et al. 2009). On the other hand, our two proposed scenarios exhibit a significant difference regarding the FS/CD ratio within the core ear-like region. Hence, we suggest that the relative positions of contact discontinuity (FS/CD ratio) could be regarded as an observational diagnosis in pursuing the origin of ear-like structures observed in young type Ia SNRs. With respect to the results of diverse existing scenarios, most of them seem to be in fair agreement with our density gradient scenario, that is, a low FS/CD ratio is acquired within the core ear-like region (Tsebrenko & Soker 2013, 2015c; Chiotellis et al. 2021; Velázquez et al. 2023).
4. Summary and discussion
In the literature, apparent deviations from spherical symmetry in type Ia SNRs may occur under several physical circumstances: (i) a pre-existing density gradient or inhomogeneity of the surrounding ISM/CSM (Balsara et al. 2001; Guo et al. 2012; Wang et al. 2018; Lu et al. 2021; Bao et al. 2021; ii) the intrinsic anisotropy in the initial density and/or velocity distribution of the ejecta (Wang & Chevalier 2001; Orlando et al. 2012; Tsebrenko & Soker 2013, 2015c); or (iii) an anisotropic density and/or velocity distribution in the mass-losing history of the progenitor system (Blondin et al. 1996; Chiotellis et al. 2012, 2020, 2021; Velázquez et al. 2023). These hypotheses have been carefully studied and have shed some light on the peculiar morphological features observed in type Ia SNRs.
One of these morphological peculiarities is the presence of two symmetrically opposite protrusions from the overall spherical shell. Such a characteristic is often termed an ear-like structure, and its physical origin, as well as the formation processes, are of prime interest here. Despite the outstanding jet-CSM and ejecta-CSM scenarios, we find there is still some room left for exploring alternative scenarios. In this work, motivated by previous theoretical studies and recent observations, we tentatively put forward two scenarios as potential explanations for the formation of ear-like structures observed in young type Ia SNRs: (i) the feedback of CR acceleration via effective adiabatic index, γeff, with spatial variations, or (ii) the large-scale pre-existing density gradient in the local ISM. Our simulation results reveal that, in spite of the different geometric shapes, both scenarios could produce prominent protrusions well beyond the main shell, resembling the observed peculiar morphologies of several young type Ia SNRs. It should also be mentioned that concerning the cylindrical symmetry, the projected protrusions are axisymmetrical and located in opposite directions, consistent with X-ray observations.
Specifically, regarding the spatially dependent γeff scenario, the arched protrusion is shaped at the equator, protruding well beyond the main spherical shell. The appearance of such a peculiar feature is attributed to the adoption of spatially dependent γeff, since a lower γeff causes a local FS to expand slower, leading to the “shrinking” of the intershock region. This process drives an accumulative difference between the radii of the FS in different azimuthal directions as time proceeds, thus yielding the formation of an ear-like structure. As for the density gradient scenario, the produced triangular protrusion is located within the low-density region. The formation of such a peculiar feature is mainly due to the density gradient in the local ISM. More explicitly, a part of the shell tends to retain itself in the low-density region, while the remaining part experiences more of the density gradient (with a gradually increasing density). Such a difference manifests itself in the expanding radius of the FS with different azimuthal angles and accumulates as time evolves, thus leading to the formation of an ear-like structure. For both cases, during the formation of the ear-like structures, it is clear that the local FS in the ear-like region reveals a faster expansion velocity than that of the remaining part (see Figs. 3 and 5). Such a result is consistent with the inferences drawn from the X-ray observations of Kepler’s SNR (Vink 2008) and G1.9+0.3 (Borkowski et al. 2017, 2024).
Since the two proposed scenarios can produce evident ear-like structures, it warrants a physical justification for the specific configurations for our benchmark cases. Concerning the spatial-dependent γeff scenario, as the efficient shock acceleration is generally expected in the presence of fast shock in young SNRs, setting an inefficient acceleration region in the vicinity of the explosion center calls for a theoretical interpretation. In the theory of NLDSA, the amplified magnetic field and a high level of magnetic-field turbulence are essential for enhancing the scattering of accelerated particles both upstream and downstream of the shock front (Blasi 2013; Amato 2014). If the particles cannot be effectively scattered back to the shock front, then the acceleration process becomes inefficient (Morlino 2017).
In the postshock region, numerical simulations have revealed several physical processes to amplify the downstream magnetic field beyond simple shock compression (Jun & Norman 1996; Inoue et al. 2009; Guo et al. 2012; Xu & Lazarian 2017). Therefore, possible explanations for our setup probably lie in the upstream conditions: (i) a weak background magnetic field or inefficient magnetic-field amplification, (ii) a low level of magnetic-field turbulence or the magnetic-field turbulence being substantially dampened by the presence of neutral hydrogen in the ISM (Vink 2020), and (iii) low injection rate due to specific shock obliquity (Völk et al. 2003; Caprioli & Spitkovsky 2014). Considering the inhomogeneous nature of the ISM and recent observational evidence (Cassam-Chenaï et al. 2008; Hovey et al. 2018; Tsuji et al. 2021; Reynolds et al. 2021; Sapienza et al. 2022), we deem that certain local regions surrounding young SNRs are characterized by conditions hindering efficient particle acceleration. However, there is a lack of observational evidence regarding the actual size and shape of such local regions. In this regard, our initial setup, being exploratory and hypothetical, should be taken with caution.
As for the density gradient scenario, our initial setup for Model B reveals a plane-stratified gas distribution with a low-density region in the immediate vicinity of the explosion center. Such an interstellar low-density tunnel or cavity (probably the remnant of previous SNe or stellar-wind bubbles) has been proposed to interpret the appearance and emission properties of several peculiar sources: SNR VRO 42.05.01 (Landecker et al. 1982; Pineault et al. 1985, 1987; Landecker et al. 1989), SNR G320.4−1.2 (Gaensler et al. 1999; Dubner et al. 2002), and SNR CTA 1 (Pineault et al. 1997). For the case of SNR G320.4−1.2, the authors have argued that the supernova explosion occurred in close proximity to the elongated low-density cavity (n0 ∼ 0.01 cm−3) and part of the SNR shell has crossed the entire cavity (Gaensler et al. 1999).
Considering the simulated age of our benchmark SNR (1000 years) and the cumulative effect in shaping evident ear-like structures (see Figs. 3 and 5), the proposed low-density tunnel shall be in the vicinity of the explosion center, providing sufficient interaction time. However, it is worth mentioning that the start point of the density gradient does not necessarily coincide with the explosion center; namely, a moderate shift of the start point away from the explosion center in z-direction is feasible (see panel b in Fig. 6). Specifically, based on Model B, we have implemented a series of simulation runs, where the start point of the density gradient has been placed at different zshift values, while other configurations remain unchanged. Our results reveal that, with a moderate shift (|zshift|< ∼ 0.5 pc), the ear-like structure produced at 1000 years, while slightly asymmetric, is comparable to the result obtained from Model B. Besides, a similar shift also works for the spatially dependent γeff scenario (see panel a in Fig. 6), where zshift marks the perpendicular distance in z-direction from the explosion center to the central horizontal line of the inefficient acceleration region.
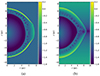 |
Fig. 6. Density profiles of our benchmark type Ia SNR at 1000 years. Panel (a) illustrates the result of the spatially dependent γeff scenario with γeff = 1.1 and zshift = 0.5 pc, where zshift marks the perpendicular distance in z-direction from the explosion center to the central horizontal line of the inefficient acceleration region. Panel (b) depicts the result of the density gradient scenario with a shift of the start point away from the explosion center in z-direction (zshift = 0.5 pc). The color bars show the logarithm of density in units of mH cm−3. |
The above discussion applies to young type Ia SNRs such as Kepler’s SNR and SNR G1.9+0.3. As for SNR G299.2–2.9, its age heavily depends on the estimated source distance and the correlation between these two physical quantities can be roughly described by τ ∼ 900d (Park et al. 2007), where τ is the SNR age (in units of year), while d is the distance to the remnant (in units of kpc). However, there is considerable divergence regarding the estimated source distance, ranging from 0.5 to 11 kpc (Slane et al. 1996; Park et al. 2007; Shan et al. 2019). Hence, the derived age of SNR G299.2–2.9 is subject to significant uncertainty. If this specific source is a middle-aged remnant, rather than a young SNR, then a further shift away from the explosion center might be expected. In addition, some discussions pertaining to our simulated results are in order, as detailed below.
(i) As depicted in Figs. 2 and 4, the formed ear-like structures differ in geometric shape and size. Such a difference, mainly attributed to the specific configurations for each scenario, could not serve as a criterion to distinguish between the two proposed prescriptions. Taking our first scenario as an example, a triangular protrusion might be produced if the spatial variations of γeff follow a tailored parameterized function (Orlando et al. 2012). In addition, by analyzing the output data, we find that the two proposed scenarios exhibit a significant difference regarding the FS/CD ratio within the core ear-like region, which may serve as an observational diagnosis in pursuing the origin of ear-like structures. Finally, considering the cylindrical symmetry, the formed ear-like structure at the equator is actually the projection of an equatorial ring or torus.
(ii) In our simulations, we tend to assess the potential impact of the two proposed prescriptions on shaping the ear-like structures, rather than model any specific type Ia SNR. The latter process requires a detailed modeling and fine-tuning of the model parameters, whereas our chosen parameter space is restricted and incapable of covering all cases with ear-like structures (Chiotellis et al. 2021). Nevertheless, we deem that the two proposed scenarios are workable, as the formed prominent protrusions revealing similarities with the peculiar features observed in several young type Ia SNRs.
In addition, it is intriguing to note that only the three mentioned cases have clearly been identified as type Ia ear-like SNRs (noting Fig. 1 of this work; also see Tsebrenko & Soker 2015a), which are all of Galactic origin and take up only 1% of the total SNR population in the Galaxy (Green 2014). Concerning this issue, two points are of prime importance: the quantitative prediction of type Ia SNRs with “ears” in theory and the visibility of an ear-like structure in observations. Regarding the former, several independent physical mechanisms have been claimed as possible ear-formation solutions, while the actual origin is still under debate. Thus, it is rather difficult to estimate the fraction of type Ia SNRs possessing ear-like features, despite the crude upper limit (∼10 − 30%) given by Tsebrenko & Soker (2015a). The latter primarily depends on several aspects: (1) the intrinsic lifetime of an ear-like structure, which heavily relies on different scenarios triggering the ear-formation process; (2) the viewing angle of the observers. Since the ear-like protrusions are actually the projections of their counterparts in real space, the observed morphologies are supposed to be a function of the viewing angle; (3) the distance from the source to the Earth. Limited by the resolution and sensitivity of current instruments, the qualified candidates here primarily refer to well-resolved near-by SNRs (mostly within the Galaxy) that allow for the ear-like structures to be identified or discarded (Tsebrenko & Soker 2015a). In summary, both mentioned factors could hinder a reasonable estimate of type Ia SNRs with “ears”.
(iii) Since ear-like structures are primarily identified through X-ray imaging, it is necessary to engage in a qualitative discussion about their emission properties based on our simulation results. Specifically, regarding the spatially dependent γeff scenario, the expected synchrotron emission from accelerated electrons might be fainter in the core ear-like region, due to the assumed inefficient acceleration there. On the other hand, as the thermal X-ray emission scales with the squared density of the shocked gas, the remnant is expected to be fainter in the core ear-like region where the shocked gas density is lower than its counterpart in the adjacent SNR shell (see Fig. 2).
As for the density gradient scenario, since the formed protrusion is located within the low-density region, the expected thermal X-ray emission in the core ear-like region shall be weak owing to a low post-shock plasma density; thus, it may probably be hard to detect (Tsebrenko & Soker 2015a). On the other hand, considering that the number density of the accelerated electrons is generally found to be a fraction of the total particle density (Ellison et al. 2000; Ellison & Cassam-Chenaï 2005), the expected synchrotron emission shall also be faint in the core ear-like region.
When compared with the X-ray images of the three representative cases studied here (see Fig. 1), it is apparent that our simple simulation-based inference does not agree well with the observed X-ray morphologies of Kepler’s SNR and SNR G1.9+0.3, as they possess ear-like structures with equal or even higher X-ray brightness than the rest of the remnant. We find that the result of SNR G299.2−2.9 seems more aligned with our model, as indeed the core ear-like region appears fainter in the X-ray map. Such an inconsistency may indicate that: (1) the physical origin of the ear-like structures seen in young type Ia SNRs varies from source to source and our proposed scenarios are incapable of interpreting all cases concerning the emission properties; and (2) the astrophysical environment where the three SNRs evolve is more complicated than our simple assumptions here and various physical processes may work simultaneously, thus leaving an imprint on the emission morphologies and making the X-ray map time-variable.
For example, the rapid variations of X-ray flux, which have been discovered in several young type Ia SNRs, may complicate such a comparison. One particular case of such is SNR G1.9+0.3, the only remnant known to be brightening in both the radio (Green et al. 2008; Murphy et al. 2008; Luken et al. 2020) and X-ray bands (Carlton et al. 2011; Borkowski et al. 2017). Recently, for this specific source, Borkowski et al. (2024) presented a spatially resolved analysis of X-ray flux evolution over a time baseline of 13 years, roughly 12% of the estimated age. They confirmed a global flux increase rate of +1.2% yr−1, but with large spatial variations, from −3% yr−1 to +7% yr−1 in different regions. Regarding the ear-like structures of interest, it is found that the east ear-like region is brightening with an area-averaged rate of about +1.0% yr−1 to +2.7% yr−1 (see Figs. 4, 10, and 11 in Borkowski et al. 2024 for details), while the west ear-like region seems to be fading with an area-averaged rate of about −0.5% yr−1 (see Figs. 4 and 15 in Borkowski et al. 2024 for details). As for Tycho’s SNR, another archetypal example of young type Ia SNRs but without evident “ears,” similar evidence was also found by Okuno et al. (2020). The authors reported an X-ray brightening in a local region called Src 1 by about +70% over 15 years, while another local region named Src 2 shows a darkening of about −20% during the same time period.
The rapid changes in the X-ray flux can be explained by incorporation of different physical processes, including steady evolution of the shock, expansion or compression of discrete plasma blobs, temporal evolution of the magnetic-field turbulence, or variations in the magnetic-field aspect angle (Okuno et al. 2020; Borkowski et al. 2024). In addition, small ISM clouds, embedded in a large-scale density gradient and crushed by the expanding forward shock, may also contribute to the X-ray variations in SNRs (Hwang et al. 2005; Park et al. 2007; Hwang et al. 2008). Clearly, most of the proposed hypotheses are relevant to the complex environment surrounding SNRs. If the time variability of X-ray flux is a long-term process as well as a universal feature of young type Ia SNRs, then the overall X-ray morphology may significantly change with time and the aforementioned inconsistency could be partly alleviated.
(iv) Clearly, our proposed scenarios are not problem-free. For example, considering the viewing angle, the projected size of an ear-like structure is probably smaller than its actual scale in real space. Concerning our density gradient scenario, a large-size protrusion could be obtained by adjusting the initial setup of the density distribution. For our first scenario, it is difficult to enlarge the size of a protrusion further as γeff = 1.1 actually corresponds to the most extreme case (Blondin & Ellison 2001; Orlando et al. 2012). In such circumstances, the ear-formation process might not be solely attributed to the spatially dependent γeff. This tension could be alleviated to some extent by the incorporation of the density gradient scheme or other viable scenarios. If our claim holds, then the formation of an ear-like structure is partly owing to a contribution from the spatially dependent γeff and partly associated with other relevant physical processes.
According to the current theory of SNe Ia (Livio & Mazzali 2018), it seems difficult to interpret the observed ear-like structures in the context of the jet-CSM model as the progenitor system is less capable of launching the desired jets in common cases. In addition, several authors have suggested that the presence of two ear-like protrusions is an indication of a possible SNIP process; namely, an SNe Ia exploding inside planetary nebulae (Tsebrenko & Soker 2015a). With respect to our two proposed scenarios, we regard them as potential alternatives, where the ear-like structures originate in pure ejecta-ISM interaction rather than jet-CSM or ejecta-CSM interaction. Moreover, since the produced protrusions here have resulted from different physical processes that are actually independent, the two proposed scenarios seem to be compatible with each other rather than mutually exclusive. Therefore, in principle, our proposed scenarios could combine together and be applied to more complex systems; for example, the multi-ear SNRs like G290.1–0.8 (García et al. 2012) and N63A (Warren et al. 2003; Karagöz et al. 2023). Meanwhile, if the spatial dependence on the adiabatic index and/or ISM density gradients around the explosion center is achieved in core-collapse SNe, the main conclusions drawn in this work could be extended to the formation of ear-like structures in core-collapse SNRs.
Extensive progress in terms of both theory and observations has been made to deepen our understanding toward the evolution of type Ia SNRs. Yet, several key issues regarding the observed ear-like structures are not fully understood. In this regard, all existing hypotheses should remain open for further discussion. Moreover, observations with an improved resolution and sensitivity, will allow for detailed spectroscopic investigations and provide beneficial insights into the formation mechanism of ear-like structures in young type Ia SNRs.
For this specific case, the simulation domain is set as (0, 10) × (−8.5, 8.5) pc to visualize the entire reproduced ear-like structure along the r-axis.
Acknowledgments
This work is partially supported by National Natural Science Foundation of China (NSFC, 12233006, 12203042), and the Foundations of Yunnan Province 202301AU070009, 202001AU070100.
References
- Akashi, M., & Soker, N. 2021, MNRAS, 501, 4053 [NASA ADS] [CrossRef] [Google Scholar]
- Amato, E. 2014, Int. J. Mod. Phys. D, 23, 1430013 [CrossRef] [Google Scholar]
- Arthur, S. J., & Falle, S. A. E. G. 1993, MNRAS, 261, 681 [CrossRef] [Google Scholar]
- Balsara, D., Benjamin, R. A., & Cox, D. P. 2001, ApJ, 563, 800 [NASA ADS] [CrossRef] [Google Scholar]
- Bao, B. W., Peng, Q. Y., Yang, C. Y., et al. 2021, ApJ, 909, 173 [NASA ADS] [CrossRef] [Google Scholar]
- Blair, W. P., Ghavamian, P., Long, K. S., et al. 2007, ApJ, 662, 998 [NASA ADS] [CrossRef] [Google Scholar]
- Blasi, P. 2013, A&ARv, 21, 70 [Google Scholar]
- Blondin, J. M., & Ellison, D. C. 2001, ApJ, 560, 244 [NASA ADS] [CrossRef] [Google Scholar]
- Blondin, J. M., Lundqvist, P., & Chevalier, R. A. 1996, ApJ, 472, 257 [Google Scholar]
- Borkowski, K. J., Reynolds, S. P., Hwang, U., et al. 2013, ApJ, 771, L9 [NASA ADS] [CrossRef] [Google Scholar]
- Borkowski, K. J., Reynolds, S. P., Green, D. A., et al. 2014, ApJ, 790, L18 [NASA ADS] [CrossRef] [Google Scholar]
- Borkowski, K. J., Gwynne, P., Reynolds, S. P., et al. 2017, ApJ, 837, L7 [NASA ADS] [CrossRef] [Google Scholar]
- Borkowski, K. J., Reynolds, S. P., Green, D. A., et al. 2024, ApJ, 973, 170 [NASA ADS] [CrossRef] [Google Scholar]
- Caprioli, D., & Spitkovsky, A. 2014, ApJ, 783, 91 [CrossRef] [Google Scholar]
- Carlton, A. K., Borkowski, K. J., Reynolds, S. P., et al. 2011, ApJ, 737, L22 [NASA ADS] [CrossRef] [Google Scholar]
- Cassam-Chenaï, G., Hughes, J. P., Ballet, J., et al. 2007, ApJ, 665, 315 [CrossRef] [Google Scholar]
- Cassam-Chenaï, G., Hughes, J. P., Reynoso, E. M., et al. 2008, ApJ, 680, 1180 [CrossRef] [Google Scholar]
- Castelletti, G., Dubner, G., Golap, K., et al. 2006, A&A, 459, 535 [NASA ADS] [CrossRef] [EDP Sciences] [Google Scholar]
- Chiotellis, A., Schure, K. M., & Vink, J. 2012, A&A, 537, A139 [NASA ADS] [CrossRef] [EDP Sciences] [Google Scholar]
- Chiotellis, A., Boumis, P., & Spetsieri, Z. T. 2020, Galaxies, 8, 38 [NASA ADS] [CrossRef] [Google Scholar]
- Chiotellis, A., Boumis, P., & Spetsieri, Z. T. 2021, MNRAS, 502, 176 [NASA ADS] [CrossRef] [Google Scholar]
- Decourchelle, A., Ellison, D. C., & Ballet, J. 2000, ApJ, 543, L57 [NASA ADS] [CrossRef] [Google Scholar]
- Dohm-Palmer, R. C., & Jones, T. W. 1996, ApJ, 471, 279 [NASA ADS] [CrossRef] [Google Scholar]
- Dubner, G. M., Gaensler, B. M., Giacani, E. B., et al. 2002, ApJ, 123, 337 [CrossRef] [Google Scholar]
- Dwarkadas, V. V. 2000, ApJ, 541, 418 [NASA ADS] [CrossRef] [Google Scholar]
- Dwarkadas, V. V., & Chevalier, R. A. 1998, ApJ, 497, 807 [NASA ADS] [CrossRef] [Google Scholar]
- Ellison, D. C., Berezhko, E. G., & Baring, M. G. 2000, ApJ, 540, 292 [NASA ADS] [CrossRef] [Google Scholar]
- Ellison, D. C., & Cassam-Chenaï, G. 2005, ApJ, 632, 920 [NASA ADS] [CrossRef] [Google Scholar]
- Ferrand, G., Decourchelle, A., Ballet, J., et al. 2010, A&A, 509, L10 [NASA ADS] [CrossRef] [EDP Sciences] [Google Scholar]
- Frashcetti, F., Teyssier, R., Ballet, J., et al. 2010, A&A, 515, A104 [NASA ADS] [CrossRef] [EDP Sciences] [Google Scholar]
- Gabici, S., Evoli, C., Gaggero, D., et al. 2019, Int. J. Mod. Phys. D, 28, 1930022 [CrossRef] [Google Scholar]
- Gaensler, B. M., Green, A. J., & Manchester, R. N. 1998, MNRAS, 299, 812 [NASA ADS] [CrossRef] [Google Scholar]
- Gaensler, B. M., Brazier, K. T. S., Manchester, R. N., et al. 1999, MNRAS, 305, 724 [NASA ADS] [CrossRef] [Google Scholar]
- García, F., Combi, J. A., Albacete-Colombo, J. F., et al. 2012, A&A, 546, A91 [Google Scholar]
- Gomez, H. L., Clark, C. J. R., Nozawa, T., et al. 2012, MNRAS, 420, 3557 [NASA ADS] [CrossRef] [Google Scholar]
- Green, D. A. 2014, Bull. Astron. Soc. India, 42, 47 [NASA ADS] [Google Scholar]
- Green, D. A., Reynolds, S. P., Borkowski, K. J., et al. 2008, MNRAS, 387, L54 [NASA ADS] [CrossRef] [Google Scholar]
- Grichener, A., & Soker, N. 2017, MNRAS, 468, 1226 [NASA ADS] [CrossRef] [Google Scholar]
- Guo, F., Li, S., Li, H., et al. 2012, ApJ, 747, 98 [NASA ADS] [CrossRef] [Google Scholar]
- Hnatyk, B., & Petruk, O. 1999, A&A, 344, 295 [NASA ADS] [Google Scholar]
- Hwang, U., Flanagan, K. A., & Petre, R. 2005, ApJ, 635, 355 [NASA ADS] [CrossRef] [Google Scholar]
- Hwang, U., Petre, R., & Flanagan, K. A. 2008, ApJ, 676, 378 [NASA ADS] [CrossRef] [Google Scholar]
- Hovey, L., Hughes, J. P., McCully, C., et al. 2018, ApJ, 862, 148 [Google Scholar]
- Inoue, T., Yamazaki, R., & Inutsuka, S. 2009, ApJ, 695, 825 [NASA ADS] [CrossRef] [Google Scholar]
- Jun, B.-I., & Norman, M. L. 1996, ApJ, 465, 800 [Google Scholar]
- Karagöz, E., Alan, N., Bilir, S., et al. 2023, MNRAS, 523, 41 [CrossRef] [Google Scholar]
- Landecker, T. L., Pineault, S., Routledge, D., et al. 1982, ApJ, 261, L41 [NASA ADS] [CrossRef] [Google Scholar]
- Landecker, T. L., Pineault, S., Routledge, D., et al. 1989, MNRAS, 237, 277 [NASA ADS] [CrossRef] [Google Scholar]
- Livio, M., & Mazzali, P. 2018, Physics Reports, 736, 1 [NASA ADS] [CrossRef] [Google Scholar]
- Lu, C. Y., Yan, J. W., Wen, L., et al. 2021, Res. Astron. Astrophys., 21, 033 [CrossRef] [Google Scholar]
- Luken, K. J., Filipović, M. D., Maxted, N. I., et al. 2020, MNRAS, 492, 2606 [NASA ADS] [CrossRef] [Google Scholar]
- Maciejewski, W., & Cox, D. P. 1999, ApJ, 511, 792 [NASA ADS] [CrossRef] [Google Scholar]
- Marcowith, A., Ferrand, G., Grech, M., et al. 2020, Liv. Rev. Comput. Astrophys, 6, 1 [CrossRef] [Google Scholar]
- Miceli, M., Bocchino, F., Iakubovskyi, D., et al. 2009, A&A, 501, 239 [NASA ADS] [CrossRef] [EDP Sciences] [Google Scholar]
- Mignone, A., Bodo, G., Massaglia, S., et al. 2007, ApJS, 170, 228 [Google Scholar]
- Mignone, A., Zanni, C., Tzeferacos, P., et al. 2012, ApJS, 198, 7 [Google Scholar]
- Morlino, G. 2017, in Supernova 1987A: 30 years Later-Cosmic Rays and Nuclei from Supernovae and their Aftermaths, eds. A. Marcowith, M. Renaud, G. Dubner, A. Ray, & A. Bykov (Cambridge Univ. Press), IAU Symp., 331, 230 [NASA ADS] [Google Scholar]
- Murata, K., & Shibazaki, N. 1996, PASP, 48, 819 [Google Scholar]
- Murphy, T., Gaensler, B. M., & Chatterjee, S. 2008, MNRAS, 389, L23 [NASA ADS] [CrossRef] [Google Scholar]
- Okuno, T., Tanaka, T., Uchida, H., et al. 2020, ApJ, 894, 50 [NASA ADS] [CrossRef] [Google Scholar]
- Orlando, S., Bocchino, F., Miceli, M., et al. 2012, ApJ, 749, 156 [NASA ADS] [CrossRef] [Google Scholar]
- Orlando, S., Miceli, M., Pumo, M. L., et al. 2016, ApJ, 822, 22 [NASA ADS] [CrossRef] [Google Scholar]
- Park, S., Slane, P. O., Hughes, J. P., et al. 2007, ApJ, 665, 1173 [Google Scholar]
- Patnaude, D. J., Badenes, C., Park, S., et al. 2012, ApJ, 756, 6 [NASA ADS] [CrossRef] [Google Scholar]
- Pavlović, M. Z. 2017, MNRAS, 468, 1616 [NASA ADS] [Google Scholar]
- Peng, Q. Y., Bao, B. W., Yang, C. Y., et al. 2020, ApJ, 891, 75 [NASA ADS] [CrossRef] [Google Scholar]
- Petruk, O. 1999, A&A, 346, 961 [NASA ADS] [Google Scholar]
- Petruk, O., Kuzyo, T., Patrii, M., et al. 2024, ApJ, 972, 63 [NASA ADS] [CrossRef] [Google Scholar]
- Pineault, S., Pritchet, C. J., Landecker, T. L., et al. 1985, A&A, 151, 52 [NASA ADS] [Google Scholar]
- Pineault, S., Landecker, T. L., & Routledge, D. 1987, ApJ, 315, 580 [NASA ADS] [CrossRef] [Google Scholar]
- Pineault, S., Landecker, T. L., Swerdlyk, C. M., et al. 1997, A&A, 324, 1152 [NASA ADS] [Google Scholar]
- Post, S., Park, S., Badenes, C., et al. 2014, ApJ, 792, L20 [NASA ADS] [CrossRef] [Google Scholar]
- Reynolds, S. P. 2008, ARA&A, 46, 89 [Google Scholar]
- Reynolds, S. P., Borkowski, K. J., Hwang, U., et al. 2007, ApJ, 668, L135 [NASA ADS] [CrossRef] [Google Scholar]
- Reynolds, S. P., Williams, B. J., Borkowski, K. J., et al. 2021, ApJ, 917, 55 [NASA ADS] [CrossRef] [Google Scholar]
- Safi-Harb, S., Dubner, G., Petre, R., et al. 2005, ApJ, 618, 321 [NASA ADS] [CrossRef] [Google Scholar]
- Sano, H., Reynoso, E. M., Mitsuishi, I., et al. 2017, JHEAp, 15, 1 [NASA ADS] [Google Scholar]
- Sapienza, V., Miceli, M., Bamba, A., et al. 2022, ApJ, 935, 152 [NASA ADS] [CrossRef] [Google Scholar]
- Shan, S. S., Zhu, H., Tian, W. W., et al. 2019, Res. Astron. Astrophys., 19, 092 [CrossRef] [Google Scholar]
- Slane, P., Vancura, O., & Hughes, J. P. 1996, ApJ, 465, 840 [NASA ADS] [CrossRef] [Google Scholar]
- Soker, N. 2010, MNRAS, 401, 2793 [NASA ADS] [CrossRef] [Google Scholar]
- Soker, N. 2022, Res. Astron. Astrophys., 22, 122003 [CrossRef] [Google Scholar]
- Tsebrenko, D., & Soker, N. 2013, MNRAS, 435, 320 [NASA ADS] [CrossRef] [Google Scholar]
- Tsebrenko, D., & Soker, N. 2015a, MNRAS, 447, 2568 [NASA ADS] [CrossRef] [Google Scholar]
- Tsebrenko, D., & Soker, N. 2015b, MNRAS, 450, 1399 [CrossRef] [Google Scholar]
- Tsebrenko, D., & Soker, N. 2015c, MNRAS, 453, 166 [Google Scholar]
- Tsuji, N., Uchiyama, Y., Khangulyan, D., et al. 2021, ApJ, 907, 117 [NASA ADS] [CrossRef] [Google Scholar]
- Tutone, A., Orlando, S., Miceli, M., et al. 2020, A&A, 642, A67 [NASA ADS] [CrossRef] [EDP Sciences] [Google Scholar]
- Ustamujic, S., Orlando, S., Miceli, M., et al. 2021, A&A, 654, A167 [NASA ADS] [CrossRef] [EDP Sciences] [Google Scholar]
- Velázquez, P. F., & Raga, A. C. 2000, A&A, 362, 780 [NASA ADS] [Google Scholar]
- Velázquez, P. F., Meyer, D. M. A., Chiotellis, A., et al. 2023, MNRAS, 519, 5358 [CrossRef] [Google Scholar]
- Vink, J. 2008, ApJ, 689, 231 [Google Scholar]
- Vink, J. 2012, A&ARv, 20, 49 [Google Scholar]
- Vink, J. 2020, Physics and Evolution of Supernova Remnants (Cham: Springer) [CrossRef] [Google Scholar]
- Völk, H. J., Berezhko, E. G., & Ksenofontov, L. T. 2003, A&A, 409, 563 [NASA ADS] [CrossRef] [EDP Sciences] [Google Scholar]
- Wang, C. Y. 2011, MNRAS, 415, 83 [NASA ADS] [CrossRef] [Google Scholar]
- Wang, C. Y., & Chevalier, R. A. 2001, ApJ, 549, 1119 [NASA ADS] [CrossRef] [Google Scholar]
- Wang, Y. Y., Bao, B. W., Yang, C. Y., et al. 2018, MNRAS, 478, 2948 [CrossRef] [Google Scholar]
- Warren, D. C., & Blondin, J. M. 2013, MNRAS, 429, 3099 [NASA ADS] [CrossRef] [Google Scholar]
- Warren, J. S., Hughes, J. P., & Slane, P. O. 2003, ApJ, 583, 260 [NASA ADS] [CrossRef] [Google Scholar]
- Warren, J. S., Hughes, J. P., Badenes, C., et al. 2005, ApJ, 634, 376 [NASA ADS] [CrossRef] [Google Scholar]
- Williams, B. J., Borkowski, K. J., Reynolds, S. P., et al. 2012, ApJ, 755, 3 [NASA ADS] [CrossRef] [Google Scholar]
- Xu, S., & Lazarian, A. 2017, ApJ, 850, 126 [NASA ADS] [CrossRef] [Google Scholar]
- Yu, H., & Fang, J. 2018, Res. Astron. Astrophys., 18, 117 [CrossRef] [Google Scholar]
- Zavala, J., Velázquez, P. F., Cerqueira, A. H., et al. 2008, MNRAS, 387, 839 [NASA ADS] [CrossRef] [Google Scholar]
- Zhou, Y. 2017a, Phys. Rep., 720, 1 [Google Scholar]
- Zhou, Y. 2017b, Phys. Rep., 723, 1 [Google Scholar]
All Tables
Parameters for the density gradient scenario: zmax = 8.5 pc, the ISM number density nmax = 0.3 cm−3, and nmin = 0.03 cm−3.
All Figures
|
Fig. 1. Chandra X-ray images of three type Ia SNRs with evident ear-like structures in opposite directions. Panel (a): Kepler’s SNR(Reynolds et al. 2007). Panel (b): SNR G1.9+0.3 (Borkowski et al. 2013). Panel (c): SNR G299.2-2.9 (Park et al. 2007). |
| In the text | |
|
Fig. 2. Density profiles of our benchmark type Ia SNR at 1000 years. Panels a–d illustrate the results for γeff = 5/3, 4/3, 6/5, 1.1, respectively. The color bars show the logarithm of density in units of mH cm−3. |
| In the text | |
|
Fig. 3. Extracted results from output data elucidating the formation process of ear-like structures. Panels (a)–(d): temporal evolution of the forward shock with different γeff, where RX curves represent the averaged shock radius with a specific azimuthal angle X(0,45,90 deg; with regard to the r-axis). Panel (e): azimuthal distribution of the forward shock radius at 1000 years with different γeff. Panel (f): derivative of shock radius with respect to the azimuthal angle at 1000 years with different γeff, with its absolute value being plotted. Panel (g): relative positions of contact discontinuity (the ratio of the forward shock radius to the contact discontinuity) at 1000 years with different γeff values. |
| In the text | |
|
Fig. 4. Density profiles of our benchmark type Ia SNR at 1000 years. Panels (a)–(b) illustrate the results for Models A and B, respectively. The color bars show the logarithm of density in units of mH cm−3. |
| In the text | |
|
Fig. 5. Extracted results from output data elucidating the formation process of ear-like structures. Panels (a)–(b): temporal evolution of the forward shock for Models A and B, respectively, where RX curves represent the averaged shock radius with a specific azimuthal angle X(0,45,90 deg; with regard to the r-axis). Panel (c): azimuthal distribution of the forward shock radius at 1000 years for Models A and B. Panel (d): derivative of shock radius with respect to the azimuthal angle at 1000 years for Models A and B, with its absolute value being plotted. Panel (e): relative positions of contact discontinuity (the ratio of the forward shock radius to the contact discontinuity) at 1000 years for Model B. |
| In the text | |
|
Fig. 6. Density profiles of our benchmark type Ia SNR at 1000 years. Panel (a) illustrates the result of the spatially dependent γeff scenario with γeff = 1.1 and zshift = 0.5 pc, where zshift marks the perpendicular distance in z-direction from the explosion center to the central horizontal line of the inefficient acceleration region. Panel (b) depicts the result of the density gradient scenario with a shift of the start point away from the explosion center in z-direction (zshift = 0.5 pc). The color bars show the logarithm of density in units of mH cm−3. |
| In the text | |
Current usage metrics show cumulative count of Article Views (full-text article views including HTML views, PDF and ePub downloads, according to the available data) and Abstracts Views on Vision4Press platform.
Data correspond to usage on the plateform after 2015. The current usage metrics is available 48-96 hours after online publication and is updated daily on week days.
Initial download of the metrics may take a while.