Fig. 6.
Download original image
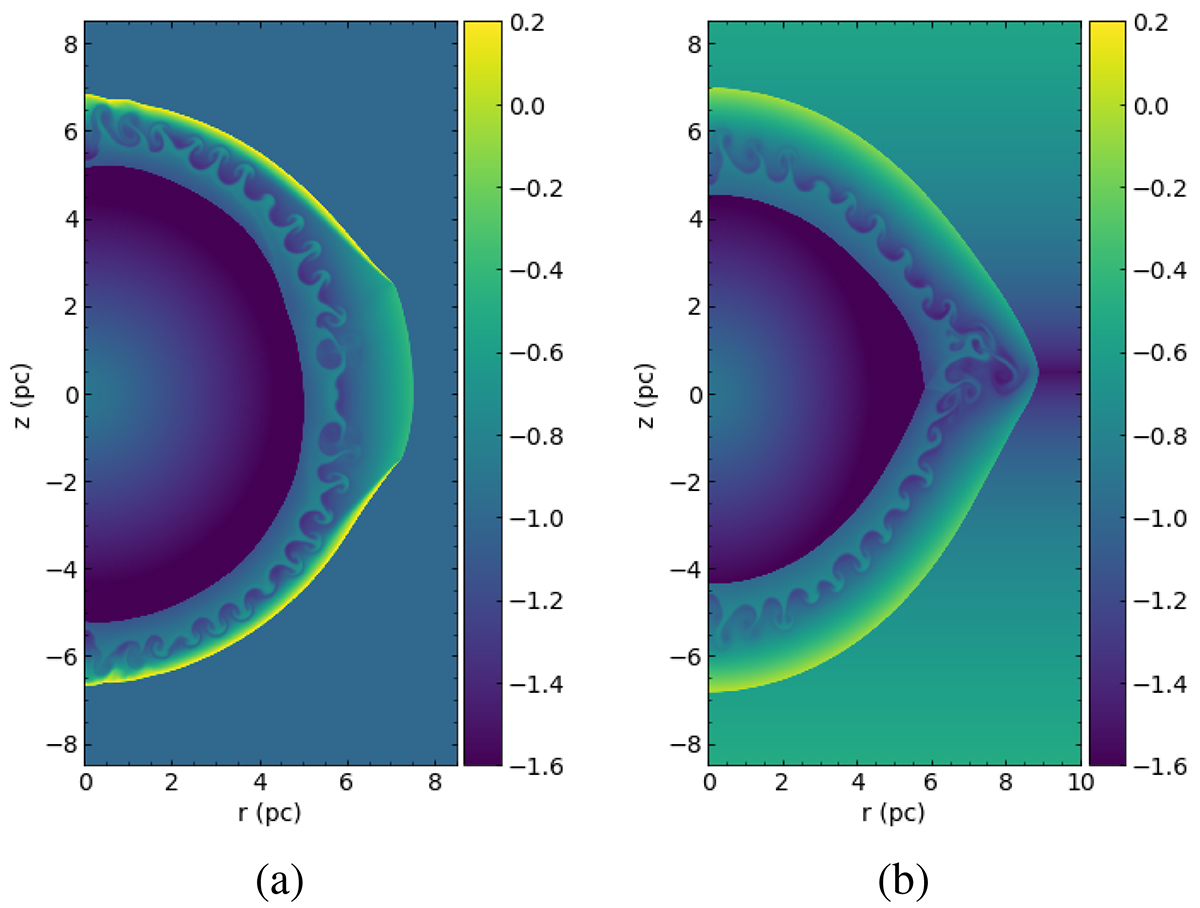
Density profiles of our benchmark type Ia SNR at 1000 years. Panel (a) illustrates the result of the spatially dependent γeff scenario with γeff = 1.1 and zshift = 0.5 pc, where zshift marks the perpendicular distance in z-direction from the explosion center to the central horizontal line of the inefficient acceleration region. Panel (b) depicts the result of the density gradient scenario with a shift of the start point away from the explosion center in z-direction (zshift = 0.5 pc). The color bars show the logarithm of density in units of mH cm−3.
Current usage metrics show cumulative count of Article Views (full-text article views including HTML views, PDF and ePub downloads, according to the available data) and Abstracts Views on Vision4Press platform.
Data correspond to usage on the plateform after 2015. The current usage metrics is available 48-96 hours after online publication and is updated daily on week days.
Initial download of the metrics may take a while.