Open Access
Fig. 8.
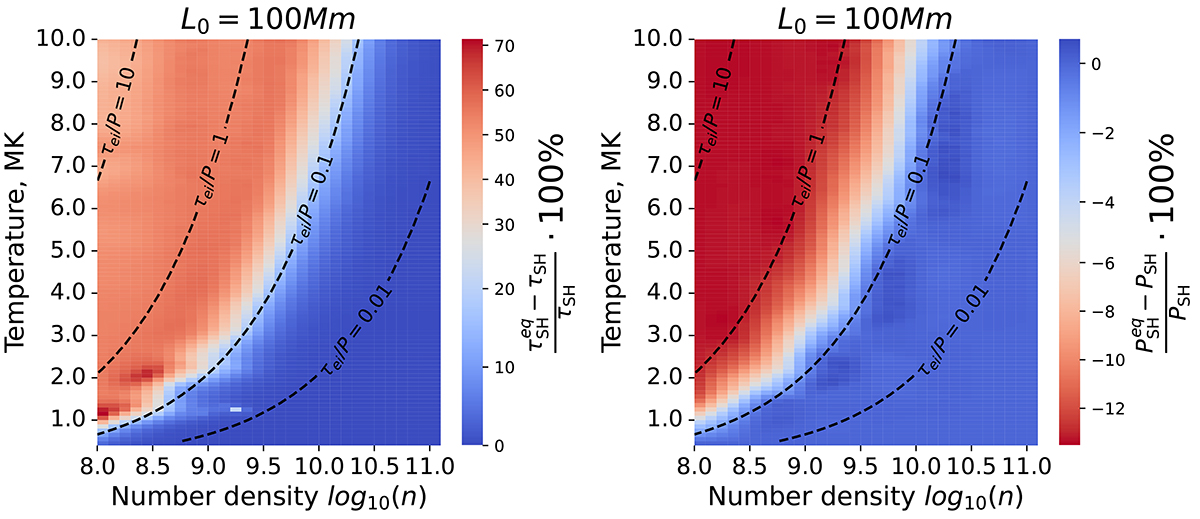
Download original image
Relative difference between damping times (left panel) and periods (right panel) of slow waves obtained for the local thermal transport model in cases of one- and two-temperature plasma. The plot was obtained by using cubic interpolation of the results from a 0.5 × 0.5 grid cell to a 0.1 × 0.1 grid cell.
Current usage metrics show cumulative count of Article Views (full-text article views including HTML views, PDF and ePub downloads, according to the available data) and Abstracts Views on Vision4Press platform.
Data correspond to usage on the plateform after 2015. The current usage metrics is available 48-96 hours after online publication and is updated daily on week days.
Initial download of the metrics may take a while.