| Issue |
A&A
Volume 677, September 2023
|
|
|---|---|---|
| Article Number | A23 | |
| Number of page(s) | 5 | |
| Section | The Sun and the Heliosphere | |
| DOI | https://doi.org/10.1051/0004-6361/202346834 | |
| Published online | 25 August 2023 | |
Bayesian evidence for two slow-wave damping models in hot coronal loops
1
Instituto de Astrofísica de Canarias, 38205 La Laguna, Tenerife, Spain
e-mail: This email address is being protected from spambots. You need JavaScript enabled to view it.
2
Departamento de Astrofísica, Universidad de La Laguna, 38206 La Laguna, Tenerife, Spain
3
Centre for Fusion, Space and Astrophysics, Physics Department, University of Warwick, Coventry CV4 7AL, UK
4
Engineering Research Institute “Ventspils International Radio Astronomy Centre (VIRAC)” of Ventspils University of Applied Sciences, Inzenieru iela 101, Ventspils 3601, Latvia
5
Centro de Investigacion en Astronomía, Universidad Bernardo O’Higgins, Avenida Viel 1497, Santiago, Chile
Received:
8
May
2023
Accepted:
3
July
2023
Abstract
We computed the evidence in favour of two models, one based on field-aligned thermal conduction alone and another that includes thermal misbalance as well, to explain the damping of slow magneto-acoustic waves in hot coronal loops. Our analysis is based on the computation of the marginal likelihood and the Bayes factor for the two damping models. We quantified their merit to explain the apparent relationship between slow mode periods and damping times, measured with SOHO/SUMER in a set of hot coronal loops. The results indicate evidence in favour of the model with thermal misbalance in the majority of the sample, with a small population of loops for which thermal conduction alone is more plausible. The apparent possibility of two different regimes of slow-wave damping, if due to differences between the loops of host active regions and/or the photospheric dynamics, may help to reveal the coronal heating mechanism.
Key words: magnetohydrodynamics (MHD) / methods: statistical / Sun: corona / Sun: oscillations
© The Authors 2023
 Open Access article, published by EDP Sciences, under the terms of the Creative Commons Attribution License (https://creativecommons.org/licenses/by/4.0), which permits unrestricted use, distribution, and reproduction in any medium, provided the original work is properly cited.
This article is published in open access under the Subscribe to Open model. This email address is being protected from spambots. You need JavaScript enabled to view it. to support open access publication.
1. Introduction
Standing and propagating slow magnetohydrodynamic (MHD) waves in the solar corona have been studied extensively over the past two decades (see e.g. De Moortel 2005; Roberts 2006; Wang et al. 2021, for comprehensive reviews). A phenomenon that has attracted particular attention is the appearance of strongly damped Doppler-shift oscillations of ultraviolet emission lines in hot coronal loops (> 6 MK), first reported by Kliem et al. (2002) and Wang et al. (2002), in observations with the Solar Ultraviolet Measurements of Emitted Radiation (SUMER) spectrometer on board SOHO. The oscillations show up in hot lines, such as Fe XIX and Fe XXI, and are related to the hot plasma component of active region loops. Hot loops are typically observed in the X-ray band and in hot ultraviolet and extreme-ultraviolet lines (Reale 2014). They correspond to those already identified in early rocket missions (Vaiana et al. 1973). Oscillations of a similar nature were also detected with the Bragg Crystal Spectrometer on Yohkoh by Mariska (2005, 2006). A quarter-period phase shift between intensity and Doppler-shift perturbations allowed for the interpretation of these observations as standing slow-mode magneto-acoustic waves. The oscillations are frequently associated with small (or micro-) flares that have an occurrence rate of 3 to 14 per hour, and lifetimes that range from 5 to 150 min (Wang et al. 2006). Many events belong to recurring episodes, with a rate of 2–3 times within a couple of hours (Wang et al. 2007; Wang 2011). The increase in the number of detected events enabled their oscillatory properties to be characterised statistically, with it being found that periods and damping times are in the ranges [10, 30] and [5, 35] min, respectively (Wang et al. 2003a,b). These oscillations have a proven seismological potential, as already demonstrated in applications to the inference of the magnetic field strength (Wang et al. 2007) and the properties of the coronal plasma heating-cooling function (Kolotkov et al. 2020), for example.
Frequently invoked mechanisms to explain the observed rapid damping of coronal slow-mode waves include thermal conduction (Ofman & Wang 2002; De Moortel & Hood 2003), compressive viscosity (Mendoza-Briceño et al. 2004; Sigalotti et al. 2007), optically thin radiation (Pandey & Dwivedi 2006), non-linear effects (Nakariakov et al. 2000), and their multiple combinations. Different mechanisms seem to be favoured depending on the damping regime (weak or strong), temperature, and density ranges. A comprehensive overview of different physical scenarios for the damping of the fundamental mode of slow magneto-acoustic oscillations in coronal loops with different lengths, temperatures, and densities under different mechanisms can be found in Prasad et al. (2021a). A table with a summary of proposed damping mechanisms and a discussion, based on the analysis of the scaling of the damping time with the wave period, is presented by Wang et al. (2021). On the other hand, an almost linear scaling between the slow-wave damping times and oscillation periods, confidently observed in the solar (see e.g. Verwichte et al. 2008; Wang 2011; Nakariakov et al. 2019) and stellar (Cho et al. 2016) coronae up to periods of 30 min and even longer, cannot be explained by any of those damping mechanisms.
A mechanism that has recently garnered increasing interest concerning the damping of slow MHD waves is the process of thermal misbalance, whereby compressive waves and a heated coronal plasma can exchange energy in a continuous interplay between wave-perturbed cooling and heating processes (Kolotkov et al. 2019). Thus, such a wave-induced thermal misbalance can enhance or suppress the damping of slow waves, depending on the parameter values of the heating-cooling model (Nakariakov et al. 2017; Kolotkov et al. 2019; Duckenfield et al. 2021). As shown by Kolotkov et al. (2019), in the regime of enhanced damping, the theoretically obtained damping rates are about those estimated from SUMER observations of hot coronal loops. Furthermore, Kolotkov & Nakariakov (2022) and Prasad et al. (2021b) considered a model with field-aligned thermal conduction and wave-induced thermal misbalance to address the scaling of the damping time with the period of standing slow waves in coronal loops observed in Doppler shift with SUMER. In particular, Kolotkov & Nakariakov (2022) show that accounting for the effect of thermal misbalance makes the relationship between the slow-wave damping time and period of a non-power-law form, unlike the damping mechanisms described above.
In this paper, we quantify the evidence in favour of each of the two damping models considered by Kolotkov & Nakariakov (2022): one with thermal conduction alone and the other with the addition of thermal misbalance. We compare the plausibility of the newly proposed thermal misbalance mechanism with respect to thermal conduction, which is used as a reference model. The aim is to assess which mechanism explains better, completely, or in part the damping properties of slow magneto-acoustic waves in hot coronal loops in SUMER observations.
2. Damping models
The theoretical prediction for the damping time of slow magneto-acoustic waves due to field-aligned thermal conduction in a weakly dissipative limit can be expressed as (e.g. Krishna Prasad et al. 2014; Mandal et al. 2016)
 (1)
(1)
Here, P is the wave period and d is the thermal conduction parameter (De Moortel & Hood 2003). We can fix the following set of physical parameters appearing in Eq. (1) using standard coronal values: the adiabatic index γ = 5/3, the field-aligned thermal conduction coefficient  [W m−1 K−1] (with T0 = 6.3 MK, which is a typical SUMER oscillation detection temperature; Wang et al. 2002), the sound speed
  (with kB being the Boltzmann constant and m = 0.6 × 1.67 × 10−27 kg being the mean particle mass), and the specific heat capacity Cv = (γ − 1)kB/m. This results in a model, MTC, with the plasma density ρ0 as the only unknown, which we collect in the parameter vector θTC = {ρ0}. For plasma densities in the range ρ0 ∈ [0.5, 10]×10−12 kg m−3, which is characteristic of hot coronal loops (Wang et al. 2007), values of d in the range d ∼ [8, 176] min were obtained, which leads to model predictions for the damping by thermal conduction in the range
 ![Mathematical equation: $ \tau^{\mathrm{TC}}_{\mathrm{D}}\sim[1.1, 360] $](/articles/aa/full_html/2023/09/aa46834-23/aa46834-23-eq4.gif) min, for periods P between 10 and 40 min typically detected in observations.
min, for periods P between 10 and 40 min typically detected in observations.
An alternative theoretical prediction for the damping time of slow magneto-acoustic modes due to a combined effect of field-aligned thermal conduction and wave-induced thermal misbalance is (Kolotkov & Nakariakov 2022)
 (2)
(2)
with τM being the thermal misbalance time determined by the properties of the coronal heating-cooling function. Equations (1) and (2) were derived under the assumption of weak dissipation, in which the ratios of the oscillation period to thermal conduction and thermal misbalance times are small. In Eq. (2),  depends on two unknowns, which we collect in the parameter vector θTM = {ρ0, τM}. For this model, plasma densities in the range ρ0 ∈ [0.5, 10]×10−12 kg m−3 (as considered before), together with values of τM in the range [1, 30] min (see e.g. Kolotkov et al. 2020, Fig. 2), lead to damping times in the range
 ![Mathematical equation: $ \tau^{\mathrm{TM}}_{\mathrm{D}}\sim[0.8, 47] $](/articles/aa/full_html/2023/09/aa46834-23/aa46834-23-eq7.gif) min, for observed periods P between 10 and 40 min.
min, for observed periods P between 10 and 40 min.
3. Evidence analysis and results
Our analysis makes use of observations of standing slow waves in coronal loops observed in Doppler shift with SUMER. The whole SUMER spectral window contains a number of lines that formed in the temperature range of 0.01–10 MK. They include the transition region line, S III/Si III at 1113 Å (0.03–0.06 MK), the coronal lines Ca X at 557 Å (0.7 MK) and Ca XIII at 1133 Å (2 MK), as well as the flare lines Fe XIX at 1118 Å (6.3 MK) and Fe XX at 567 Å (8 MK; Wang et al. 2002). We have restricted our analysis to a selection of events corresponding to detections at 6.3 MK, from those summarised in Wang et al. (2003a) and Nakariakov et al. (2019). We deliberately used data obtained with the same instrument and observed at the same emission spectral line to exclude the temperature of the emitting plasma as a free parameter. This selected SUMER observations were recently employed by Kolotkov & Nakariakov (2022) to validate Eq. (2) for the damping by thermal misbalance. In their analysis, Kolotkov & Nakariakov (2022) fixed the plasma temperature to that of the SUMER observational channel in which most standing slow-wave events were observed (6.3 MK). Treating the plasma density and the characteristic timescale of thermal misbalance as free parameters, they find a reasonable agreement between theory and observations. However, a small number of data points fall outside the region covered by the posterior predictive distribution of the samples obtained by Bayesian Markov chain Monte Carlo (MCMC) sampling (see Fig. 1 in Kolotkov & Nakariakov 2022), indicating that the effect of thermal misbalance is apparently less important in the slow-wave damping in those events.
To rigorously quantify the evidence of the two damping models given by Eqs. (1) and (2) in explaining the set of observations, we followed a similar procedure to the one employed by Arregui (2021) for the damping of transverse coronal loop oscillations, based on the application of Bayesian model comparison (see Arregui 2022; Anfinogentov et al. 2022, for reviews on recent applications in the context of coronal seismology). We first constructed a two-dimensional grid over the synthetic data space 𝒟 = (P, τD), which covers the ranges in the oscillation period and damping time in observations. The magnitude of the marginal likelihood for the two damping models over that space gives a measure of how well a particular period-damping time combination was predicted by each model. For the model with damping by thermal conduction MTC, with the parameter vector θTC, the marginal likelihood was computed as
 (3)
(3)
and likewise for the model with damping by thermal misbalance, MTM, with the parameter vector θTM. The first factor in the integrand is the likelihood function. Under the assumption of a Gaussian likelihood function and adopting an error model for the damping time alone,
![Mathematical equation: $$ \begin{aligned} p(\mathcal{D} |\boldsymbol{\theta }_{\rm TC}, M_{\rm TC}) =\frac{1}{\sqrt{2\pi } \sigma } \exp \Bigg \{-\frac{\left[\tau _{\rm D} - \tau ^\mathrm{TC}_{\rm D}(\boldsymbol{\theta }_{\rm TC})\right]^2}{2\sigma ^2}\Bigg \}, \end{aligned} $$](/articles/aa/full_html/2023/09/aa46834-23/aa46834-23-eq9.gif) (4)
(4)
and correspondingly for the thermal misbalance model. In this expression, σ is the uncertainty in the damping time τD. In the absence of specific values from the literature, this was fixed to the chosen value σ = 0.1τD. Larger uncertainty values lead to lower levels of evidence. Possible data realisations from the two considered models were generated using the theoretical predictions given by Eqs. (1) and (2) for models MTC and MTM, respectively.
The second factor in the integrand of Eq. (3) is the prior probability density of the model parameters. Based on the inference results obtained by Kolotkov & Nakariakov (2022), we chose the following Gaussian priors for the two unknown parameters: 𝒢(ρ0[10−12 kg m−3],4, 2) and 𝒢(τM[min],14.2, 5.0), with the numerical values indicating the mean and the standard deviation, respectively.
In Fig. 1 (top), we show the resulting distribution of the marginal likelihood for the two compared models of the damping, over the grid of synthetic data in the damping time and oscillation period. Although the two marginal likelihood distributions do overlap, especially in the area with periods and damping times below 20 min, the contours associated with the different levels of evidence for each model and their shape can be clearly distinguished. Marginal likelihood contours for thermal conduction alone bend upwards towards regions with weaker damping in the lower period range. Marginal likelihood contours for the model with thermal misbalance extend towards longer period values at comparatively lower damping time ranges. They nicely cover the grey-shaded area in Fig. 1 by Kolotkov & Nakariakov (2022), which represents the posterior predictive distribution obtained from the MCMC samples in their analysis. The figure also shows the location of the SUMER data plotted over the contours. Most of the data points (42 out of 49) fall over areas where the marginal likelihood for the model with thermal misbalance is larger than the marginal likelihood for the model with thermal conduction alone, and the evidence thus favours the former mechanism. For the remaining seven cases, the opposite happens and the marginal likelihood for the thermal conduction model is larger.
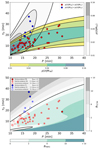 |
Fig. 1. Filled contour plot of the marginal likelihood values for the damping models MTC and MTM given by Eqs. (1) and (2), respectively (top panel), and the corresponding Bayes factors (bottom panel) over the synthetic data space 𝒟 = (P, τD). Equations (3) and (5) were computed over a grid with NP = 121 and NτD = 181 points over the ranges P ∈ [10, 40] min and τD ∈ [1, 50] min. Over-plotted in circles are the observations corresponding to standing slow waves in coronal loops observed in Doppler shift by SUMER at 6.3 MK. They are coloured according to the comparison between the marginal likelihood values (top panel) and the levels of evidence for each model (bottom panel) as indicated in the corresponding legends. |
To quantify the relative evidence between the two compared models, we assumed that the two models are equally probable a priori, p(MTC) = p(MTM), and make use of the Bayes factor, given by
 (5)
(5)
The assessment in terms of levels of evidence is based on the use of the empirical table by Kass & Raftery (1995) from the values thus obtained. The evidence in favour of model MTC ahead of model MTM is deemed inconclusive for values of BTCTM from zero to two; positive for values from two to six; strong for values from six to ten; and very strong for values above ten. A similar tabulation applies to BTMTC.
Figure 1 (bottom) shows the corresponding Bayes factor distributions. By definition, the regions where BTCTM and BTMTC reach the different levels of evidence are mutually exclusive and cannot overlap. They are clearly separated by the solid line that connects the points where p(𝒟|MTC) = p(𝒟|MTM) and thus the Bayes factors vanish, BTCTM = BTMTC = 0. In the surrounding white area, the Bayes factors are not large enough to deem there being positive evidence in favour of any of the two damping models. Then, moving towards the top-left corner, the evidence favours thermal conduction with increasing levels of evidence. Moving towards the bottom-right corner, the evidence supports thermal misbalance with increasing levels of evidence. We calculated numerical values for the Bayes factor for each of the 49 SUMER loop oscillation events. Differently coloured circles are used to represent different levels of evidence. The majority of the observed data points (32 out of 49) fall into the region where the evidence supports a model with wave-induced thermal misbalance in comparison to a model with thermal conduction alone. For several data points (13 out of 49), the evidence is inconclusive (edge-only coloured circles). In four cases, the evidence is positive (even strong in one of them) in favour of damping by thermal conduction alone.
4. Conclusion
We have considered two damping models to explain the damping of standing slow magneto-acoustic waves in hot coronal loops, and we computed the evidence in favour of each of them explaining a set of observed oscillation periods and damping times in SUMER observations with measured periods and damping times. We find a clear separation in the oscillation period and damping time data space between the regions with evidence in favour of each of the two models. The majority of the observed data points (∼65%) fall into the region where the evidence supports a model that links the oscillation damping with wave-induced thermal misbalance added to thermal conduction. Some data from the sample (∼8%) fall into the region where the evidence supports a damping model based on thermal conduction alone. These few cases may be regarded as a separate population of hot coronal loops for which particular physical or wave characteristics may make thermal conduction more plausible or dominant.
The apparent possibility of two different regimes of slow oscillation damping could possibly be attributed to some variation in the coronal heating function in the events appearing in those different regimes. In the model that links the damping with thermal misbalance, we assumed that the radiative losses and the heating function are both uniquely determined by thermodynamic parameters of the plasma, that is to say the density and temperature. However, the unknown heating function as of yet could also depend on some other parameters that are not accounted for by the model, for example the energy supply flux which may vary in time. This would make the parameter τM different in the events that belong to the two different populations (in particular, τM → ∞ for the population better described by conductive damping alone). The identification of the differences between the loops and/or parameters of host active regions and/or the photospheric dynamics in the events that belong to different populations may shed light on the differences in the heating function, and help to reveal the coronal heating mechanism.
Acknowledgments
This research was conducted while I.A. was a visitor at the Centre for Fusion, Space and Astrophysics, Department of Physics, University of Warwick. It is a pleasure for I.A. to acknowledge the financial support, the warm hospitality, and the friendly atmosphere during his visit. I.A. is supported by project PID2021-127487NB-I00 from Ministerio de Ciencia, Innovación y Universidades and FEDER funds. D.Y.K. and V.M.N. acknowledge support from the STFC consolidated grant ST/T000252/1 and the Latvian Council of Science Project “Multi-Wavelength Study of Quasi-Periodic Pulsations in Solar and Stellar Flares” No. lzp-2022/1-0017. SUMER is part of SOHO, the Solar and Heliospheric Observatory, of ESA and NASA. The SUMER project is financially supported by the Deutsches Zentrum für Luft- und Raumfahrt (DLR), the Centre National d’Etudes Spatiales (CNES), the National Aeronautics and Space Administration (NASA), and the European Space Agency’s (ESA) PRODEX programme (Swiss contribution).
References
- Anfinogentov, S. A., Antolin, P., Inglis, A. R., et al. 2022, Space Sci. Rev., 218, 9 [NASA ADS] [CrossRef] [Google Scholar]
- Arregui, I. 2021, ApJ, 915, L25 [NASA ADS] [CrossRef] [Google Scholar]
- Arregui, I. 2022, Front. Astron. Space Sci., 9, 826947 [NASA ADS] [CrossRef] [Google Scholar]
- Cho, I. H., Cho, K. S., Nakariakov, V. M., Kim, S., & Kumar, P. 2016, ApJ, 830, 110 [NASA ADS] [CrossRef] [Google Scholar]
- De Moortel, I. 2005, Royal Soc. London Philos. Trans. Ser. A, 363, 2743 [Google Scholar]
- De Moortel, I., & Hood, A. W. 2003, A&A, 408, 755 [NASA ADS] [CrossRef] [EDP Sciences] [Google Scholar]
- Duckenfield, T. J., Kolotkov, D. Y., & Nakariakov, V. M. 2021, A&A, 646, A155 [EDP Sciences] [Google Scholar]
- Kass, R. E., & Raftery, A. E. 1995, JASA, 90, 773 [CrossRef] [Google Scholar]
- Kliem, B., Dammasch, I. E., Curdt, W., & Wilhelm, K. 2002, ApJ, 568, L61 [CrossRef] [Google Scholar]
- Kolotkov, D. Y., & Nakariakov, V. M. 2022, MNRAS, 514, L51 [Google Scholar]
- Kolotkov, D. Y., Nakariakov, V. M., & Zavershinskii, D. I. 2019, A&A, 628, A133 [NASA ADS] [CrossRef] [EDP Sciences] [Google Scholar]
- Kolotkov, D. Y., Duckenfield, T. J., & Nakariakov, V. M. 2020, A&A, 644, A33 [EDP Sciences] [Google Scholar]
- Krishna Prasad, S., Banerjee, D., & Van Doorsselaere, T. 2014, ApJ, 789, 118 [Google Scholar]
- Mandal, S., Magyar, N., Yuan, D., Van Doorsselaere, T., & Banerjee, D. 2016, ApJ, 820, 13 [Google Scholar]
- Mariska, J. T. 2005, ApJ, 620, L67 [CrossRef] [Google Scholar]
- Mariska, J. T. 2006, ApJ, 639, 484 [Google Scholar]
- Mendoza-Briceño, C. A., Erdélyi, R., & Sigalotti, L. D. G. 2004, ApJ, 605, 493 [CrossRef] [Google Scholar]
- Nakariakov, V. M., Verwichte, E., Berghmans, D., & Robbrecht, E. 2000, A&A, 362, 1151 [NASA ADS] [Google Scholar]
- Nakariakov, V. M., Afanasyev, A. N., Kumar, S., & Moon, Y. J. 2017, ApJ, 849, 62 [Google Scholar]
- Nakariakov, V. M., Kosak, M. K., Kolotkov, D. Y., et al. 2019, ApJ, 874, L1 [Google Scholar]
- Ofman, L., & Wang, T. 2002, ApJ, 580, L85 [NASA ADS] [CrossRef] [Google Scholar]
- Pandey, V. S., & Dwivedi, B. N. 2006, Sol. Phys., 236, 127 [NASA ADS] [CrossRef] [Google Scholar]
- Prasad, A., Srivastava, A. K., & Wang, T. 2021a, Sol. Phys., 296, 105 [NASA ADS] [CrossRef] [Google Scholar]
- Prasad, A., Srivastava, A. K., & Wang, T. J. 2021b, Sol. Phys., 296, 20 [Google Scholar]
- Reale, F. 2014, Liv. Rev. Sol. Phys., 11, 4 [Google Scholar]
- Roberts, B. 2006, Philos. Trans. Royal Soc. London Ser. A, 364, 447 [NASA ADS] [Google Scholar]
- Sigalotti, L. D. G., Mendoza-Briceño, C. A., & Luna-Cardozo, M. 2007, Sol. Phys., 246, 187 [NASA ADS] [CrossRef] [Google Scholar]
- Vaiana, G. S., Krieger, A. S., & Timothy, A. F. 1973, Sol. Phys., 32, 81 [NASA ADS] [CrossRef] [Google Scholar]
- Verwichte, E., Haynes, M., Arber, T. D., & Brady, C. S. 2008, ApJ, 685, 1286 [NASA ADS] [CrossRef] [Google Scholar]
- Wang, T. 2011, Space Sci. Rev., 158, 397 [Google Scholar]
- Wang, T. J., Solanki, S. K., Curdt, W., Innes, D. E., & Dammasch, I. E. 2002, ApJ, 574, L101 [CrossRef] [Google Scholar]
- Wang, T. J., Solanki, S. K., Curdt, W., et al. 2003a, A&A, 406, 1105 [NASA ADS] [CrossRef] [EDP Sciences] [Google Scholar]
- Wang, T. J., Solanki, S. K., Innes, D. E., Curdt, W., & Marsch, E. 2003b, A&A, 402, L17 [NASA ADS] [CrossRef] [EDP Sciences] [Google Scholar]
- Wang, T. J., Innes, D. E., & Solanki, S. K. 2006, A&A, 455, 1105 [NASA ADS] [CrossRef] [EDP Sciences] [Google Scholar]
- Wang, T. J., Innes, D. E., & Qiu, J. 2007, ApJ, 656, 598 [NASA ADS] [CrossRef] [Google Scholar]
- Wang, T., Ofman, L., Yuan, D., et al. 2021, Space Sci. Rev., 217, 34 [CrossRef] [Google Scholar]
All Figures
|
Fig. 1. Filled contour plot of the marginal likelihood values for the damping models MTC and MTM given by Eqs. (1) and (2), respectively (top panel), and the corresponding Bayes factors (bottom panel) over the synthetic data space 𝒟 = (P, τD). Equations (3) and (5) were computed over a grid with NP = 121 and NτD = 181 points over the ranges P ∈ [10, 40] min and τD ∈ [1, 50] min. Over-plotted in circles are the observations corresponding to standing slow waves in coronal loops observed in Doppler shift by SUMER at 6.3 MK. They are coloured according to the comparison between the marginal likelihood values (top panel) and the levels of evidence for each model (bottom panel) as indicated in the corresponding legends. |
| In the text | |
Current usage metrics show cumulative count of Article Views (full-text article views including HTML views, PDF and ePub downloads, according to the available data) and Abstracts Views on Vision4Press platform.
Data correspond to usage on the plateform after 2015. The current usage metrics is available 48-96 hours after online publication and is updated daily on week days.
Initial download of the metrics may take a while.