Fig. 1.

Download original image
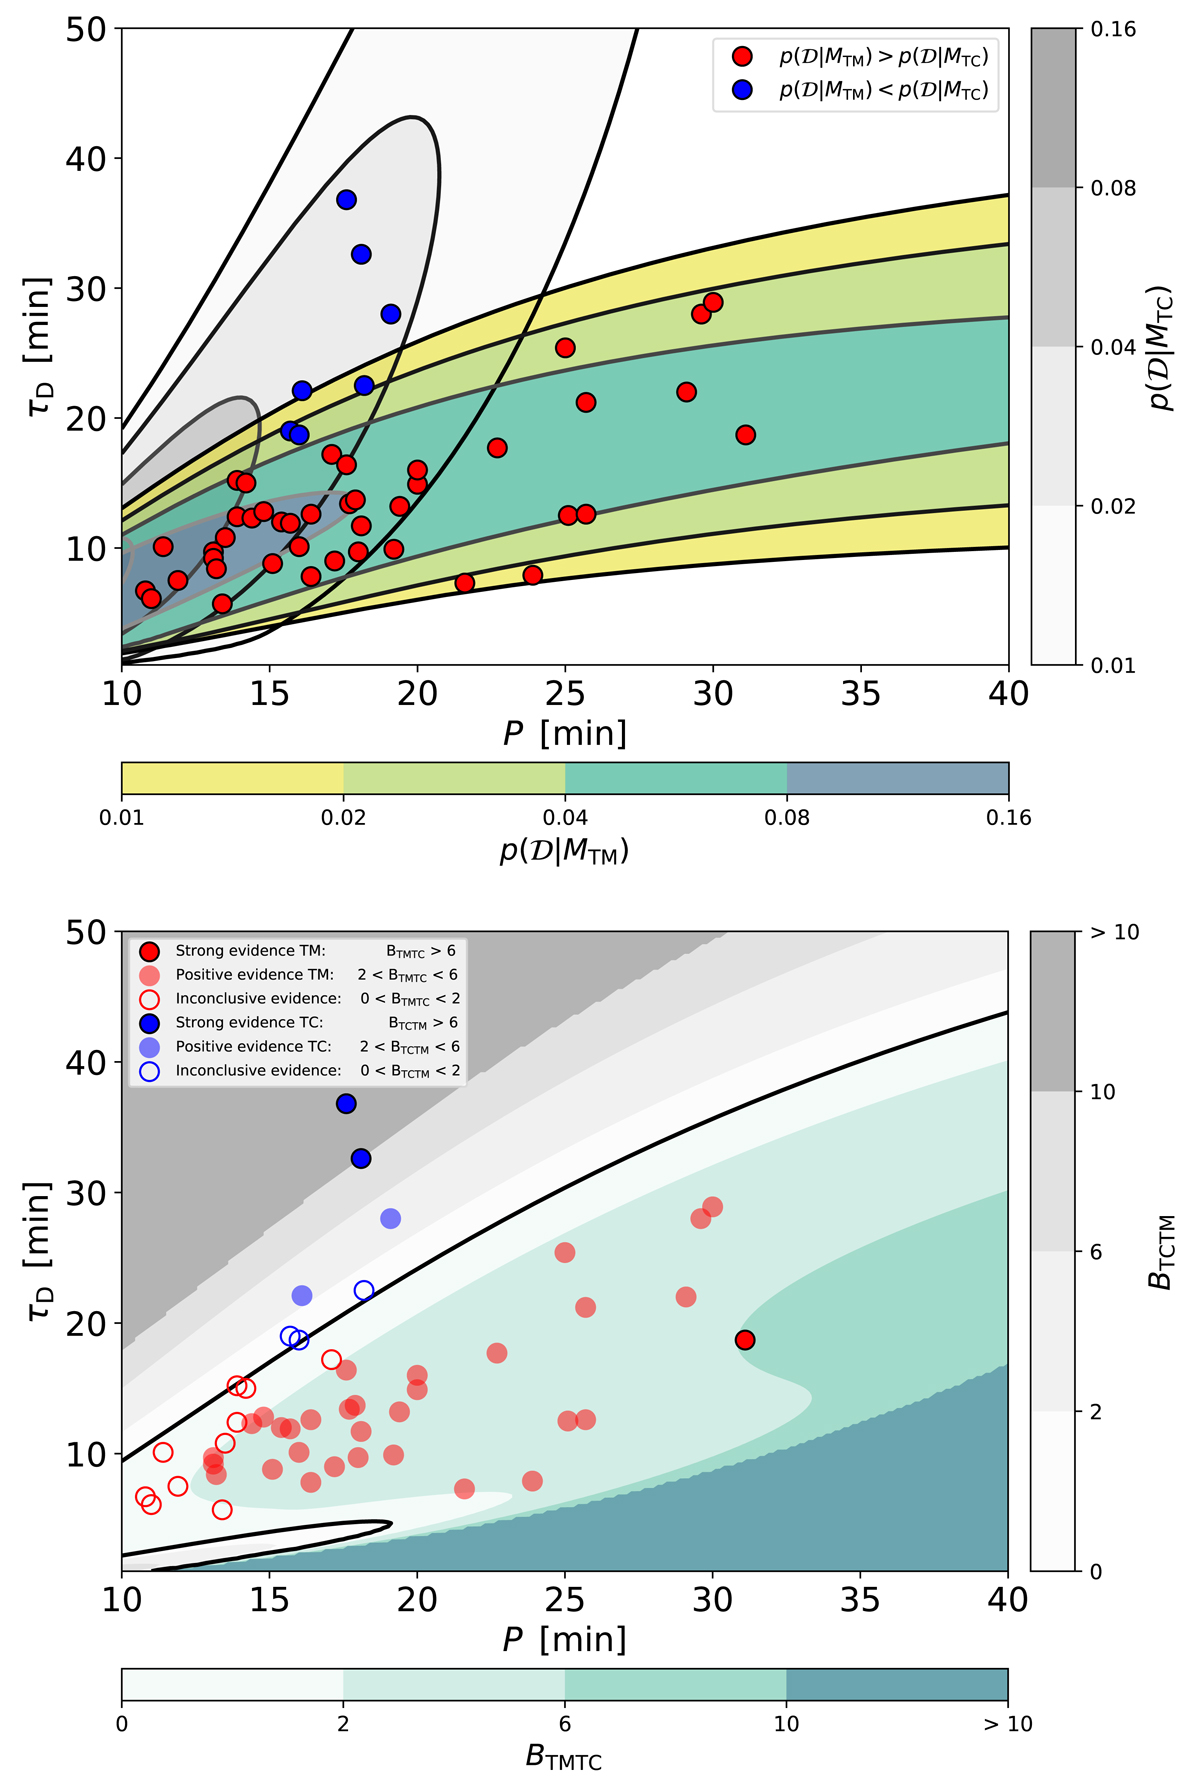
Filled contour plot of the marginal likelihood values for the damping models MTC and MTM given by Eqs. (1) and (2), respectively (top panel), and the corresponding Bayes factors (bottom panel) over the synthetic data space 𝒟 = (P, τD). Equations (3) and (5) were computed over a grid with NP = 121 and NτD = 181 points over the ranges P ∈ [10, 40] min and τD ∈ [1, 50] min. Over-plotted in circles are the observations corresponding to standing slow waves in coronal loops observed in Doppler shift by SUMER at 6.3 MK. They are coloured according to the comparison between the marginal likelihood values (top panel) and the levels of evidence for each model (bottom panel) as indicated in the corresponding legends.
Current usage metrics show cumulative count of Article Views (full-text article views including HTML views, PDF and ePub downloads, according to the available data) and Abstracts Views on Vision4Press platform.
Data correspond to usage on the plateform after 2015. The current usage metrics is available 48-96 hours after online publication and is updated daily on week days.
Initial download of the metrics may take a while.


