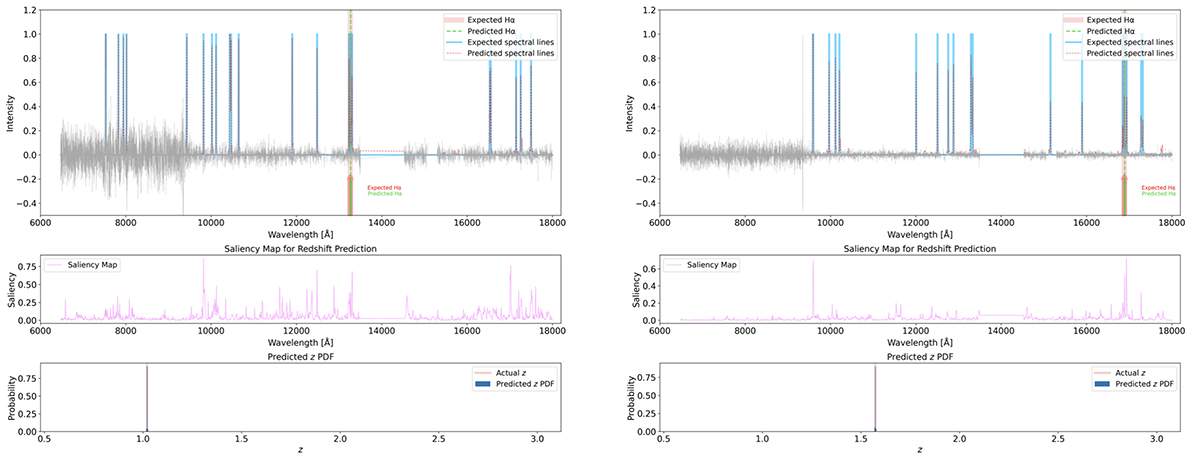
Fig. 9.
Download original image
Examples of pipeline outputs for two random galaxy spectra with successful redshift predictions (|Δz|< 0.003). Top panels: Input spectra (grey) with predicted line locations (dashed red lines) and expected spectral lines (light blue lines). The expected and predicted locations of the Hα line are marked with a red and green arrow, respectively. Middle panels: Saliency maps for redshift prediction, indicating the most influential wavelengths for the model predictions. Bottom panels: Predicted (blue) and actual (red) redshift PDFs, highlighting the accuracy of the redshift predictions.
Current usage metrics show cumulative count of Article Views (full-text article views including HTML views, PDF and ePub downloads, according to the available data) and Abstracts Views on Vision4Press platform.
Data correspond to usage on the plateform after 2015. The current usage metrics is available 48-96 hours after online publication and is updated daily on week days.
Initial download of the metrics may take a while.