Fig. 8.
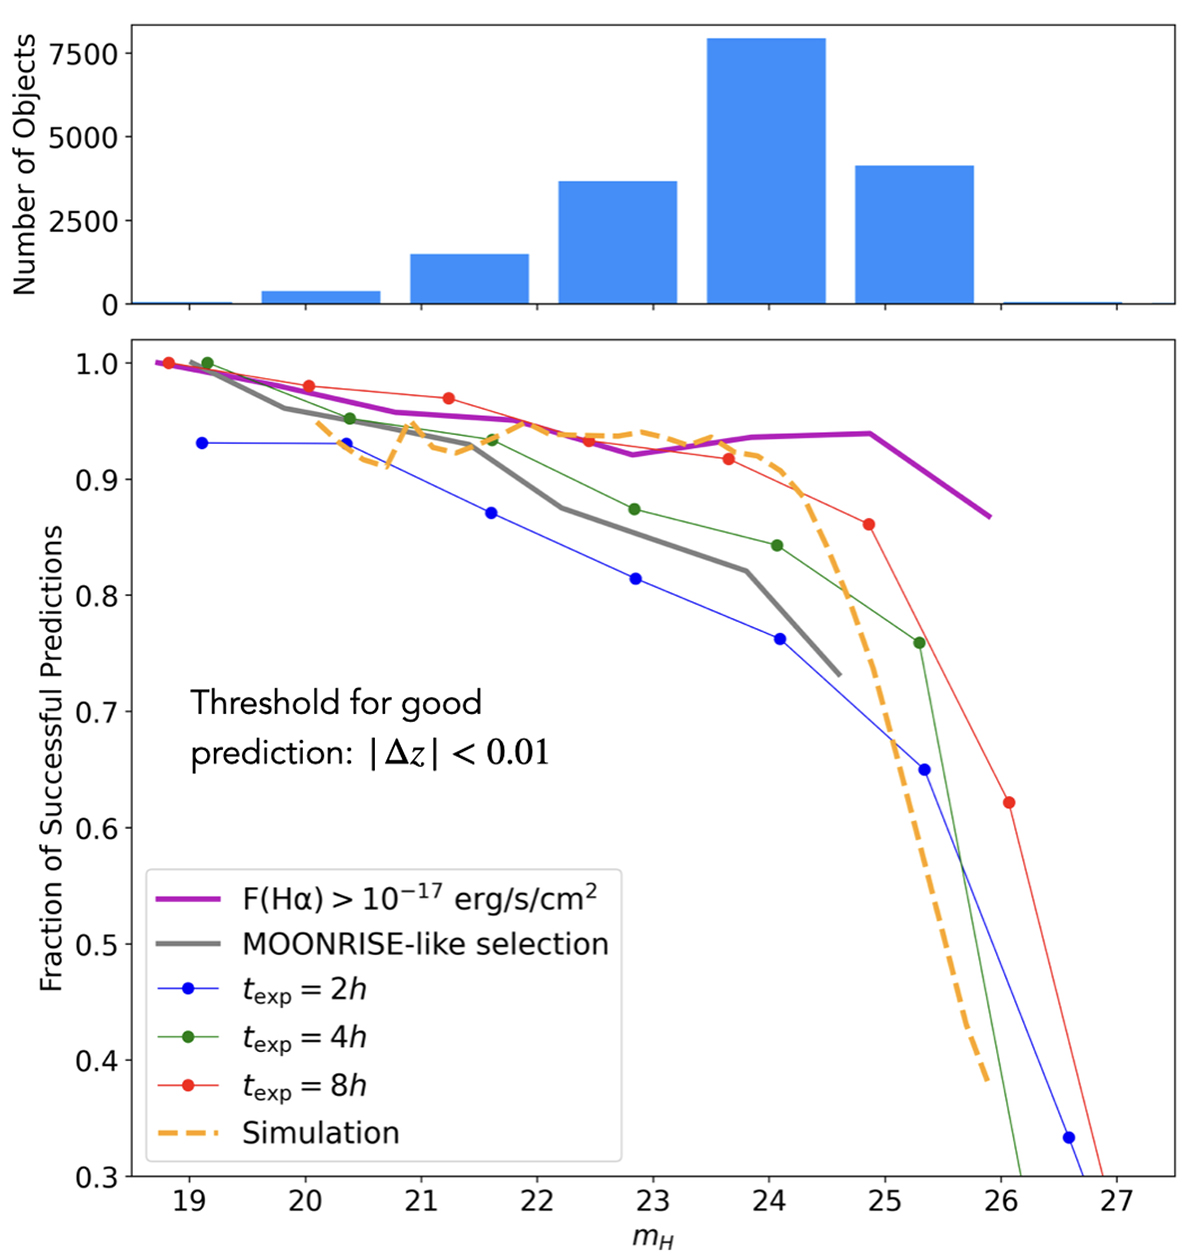
Download original image
Relationship between the fraction of successful redshift predictions (with |Δz|< 0.01) and the H-band magnitude mH. Top panel: Histogram of the number of objects as a function of mH. Bottom panel: Fraction of successful predictions as a function of mH for different subsets: galaxies with Hα flux greater than 10−17 erg/s/cm−2 (violet line), MOONRISE-like selection (grey line), and subsets with varying exposure times of 2 h (blue), 4 h (green), and 8 h (red), along with a simulated reference trend (dashed orange line). See Sect. 4 for a detailed discussion on the behaviour of the observed trends.
Current usage metrics show cumulative count of Article Views (full-text article views including HTML views, PDF and ePub downloads, according to the available data) and Abstracts Views on Vision4Press platform.
Data correspond to usage on the plateform after 2015. The current usage metrics is available 48-96 hours after online publication and is updated daily on week days.
Initial download of the metrics may take a while.