Fig. 7.
Download original image
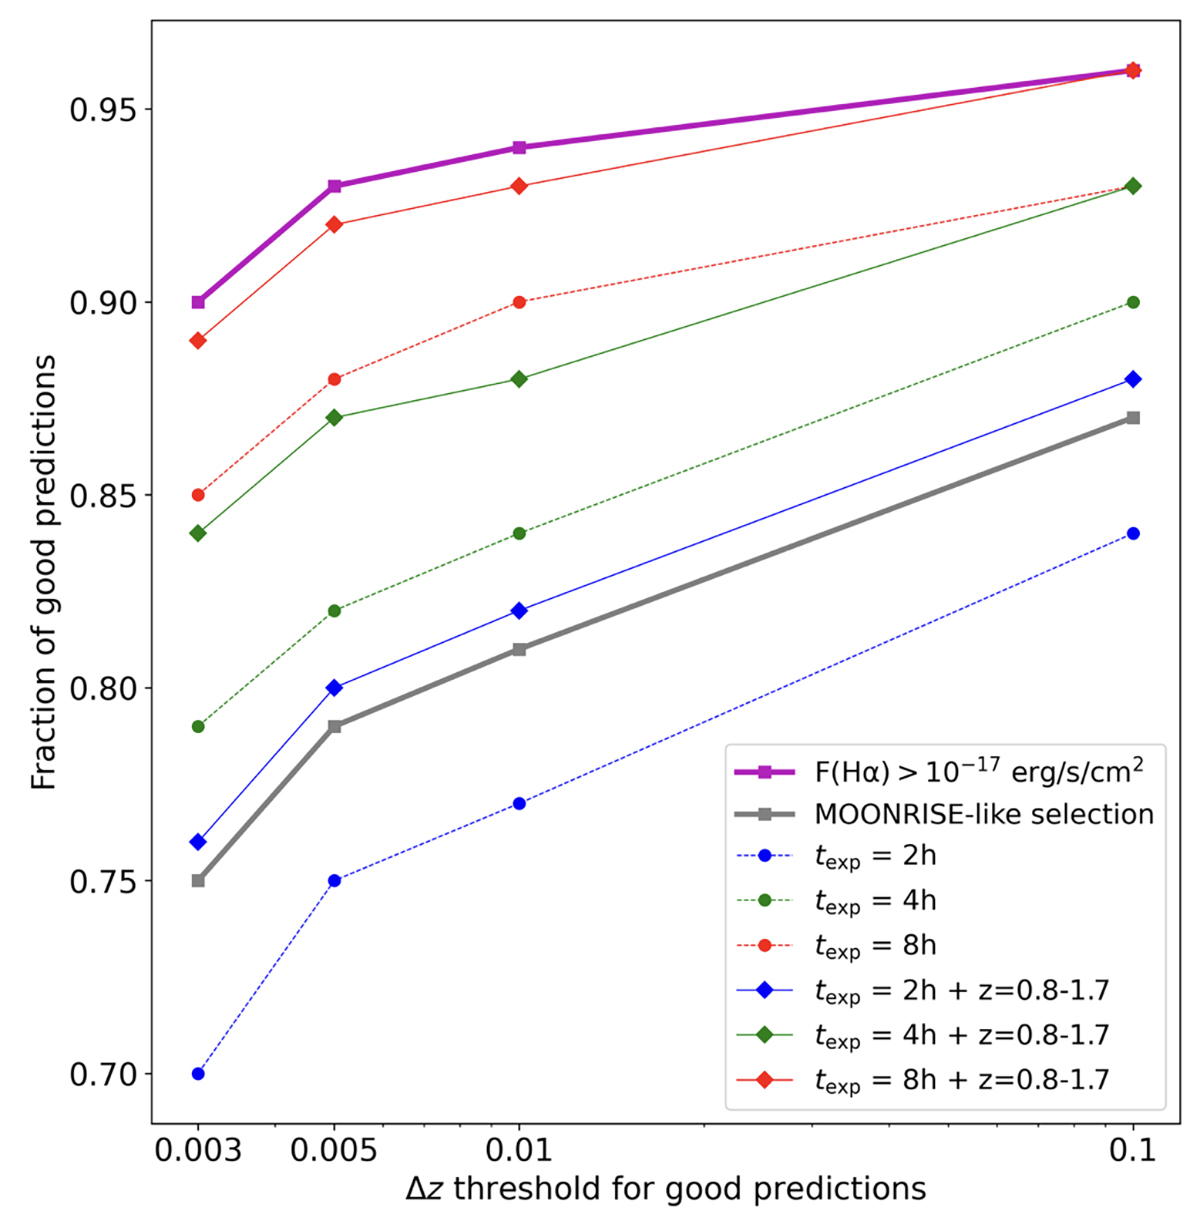
Fraction of successful redshift predictions as a function of varying Δz thresholds for different galaxy subsets. The subsets include a general division by exposure time (texp = 2 h, 4 h, 8 h, represented by dashed lines) and a more specific division by both exposure time and redshift range z = 0.8 − 1.7 (represented by solid lines in blue, green, and red). The MOONRISE-like selection is shown by the solid grey line, and bright galaxies with Hα flux greater than 10−17 erg/s/cm−2 are shown by the solid violet line. The Δz thresholds tested are 0.003, 0.005, 0.01, and 0.1.
Current usage metrics show cumulative count of Article Views (full-text article views including HTML views, PDF and ePub downloads, according to the available data) and Abstracts Views on Vision4Press platform.
Data correspond to usage on the plateform after 2015. The current usage metrics is available 48-96 hours after online publication and is updated daily on week days.
Initial download of the metrics may take a while.