Fig. 3.
Download original image
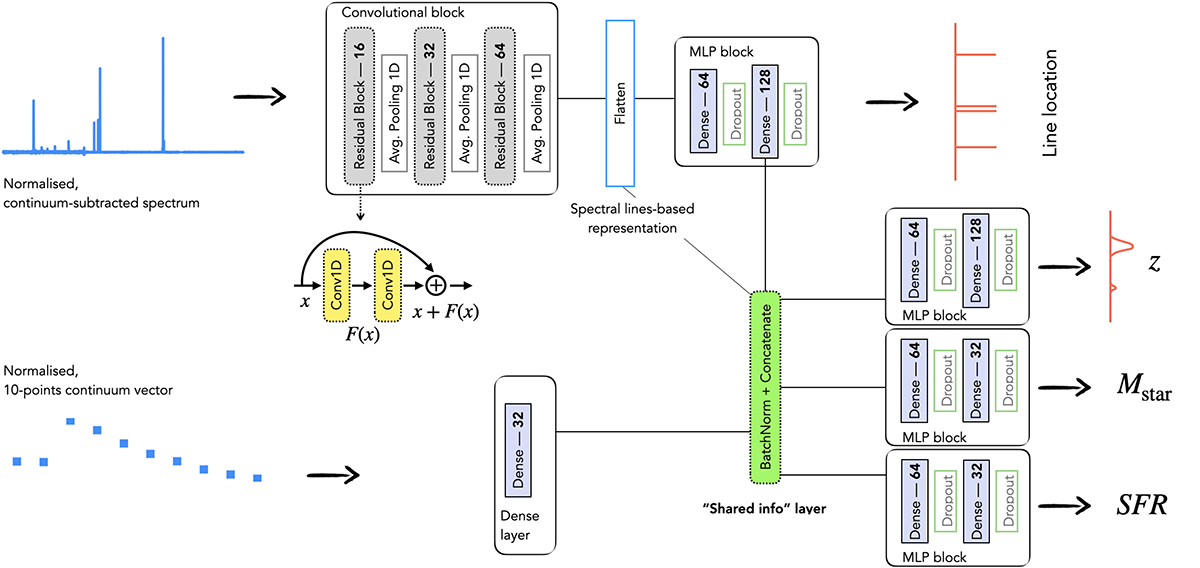
Architecture of M-TOPnet, the deep learning pipeline used for the galaxy spectral analysis in this work. Our model accepts two inputs: a normalised, continuum-subtracted spectrum and a normalised continuum vector. The spectrum is processed through convolutional residual blocks to extract spectral features, while the continuum vector is encoded through a dense layer. Outputs from both branches, along with intermediate outputs from the line location task, are combined into a shared information layer. This shared layer feeds into task-specific branches consisting of MLPs to predict line locations, redshift, and normalised values of Mstar, and SFR. See a discussion on the different components in Sect. 3.2.
Current usage metrics show cumulative count of Article Views (full-text article views including HTML views, PDF and ePub downloads, according to the available data) and Abstracts Views on Vision4Press platform.
Data correspond to usage on the plateform after 2015. The current usage metrics is available 48-96 hours after online publication and is updated daily on week days.
Initial download of the metrics may take a while.