Fig. 2.
Download original image
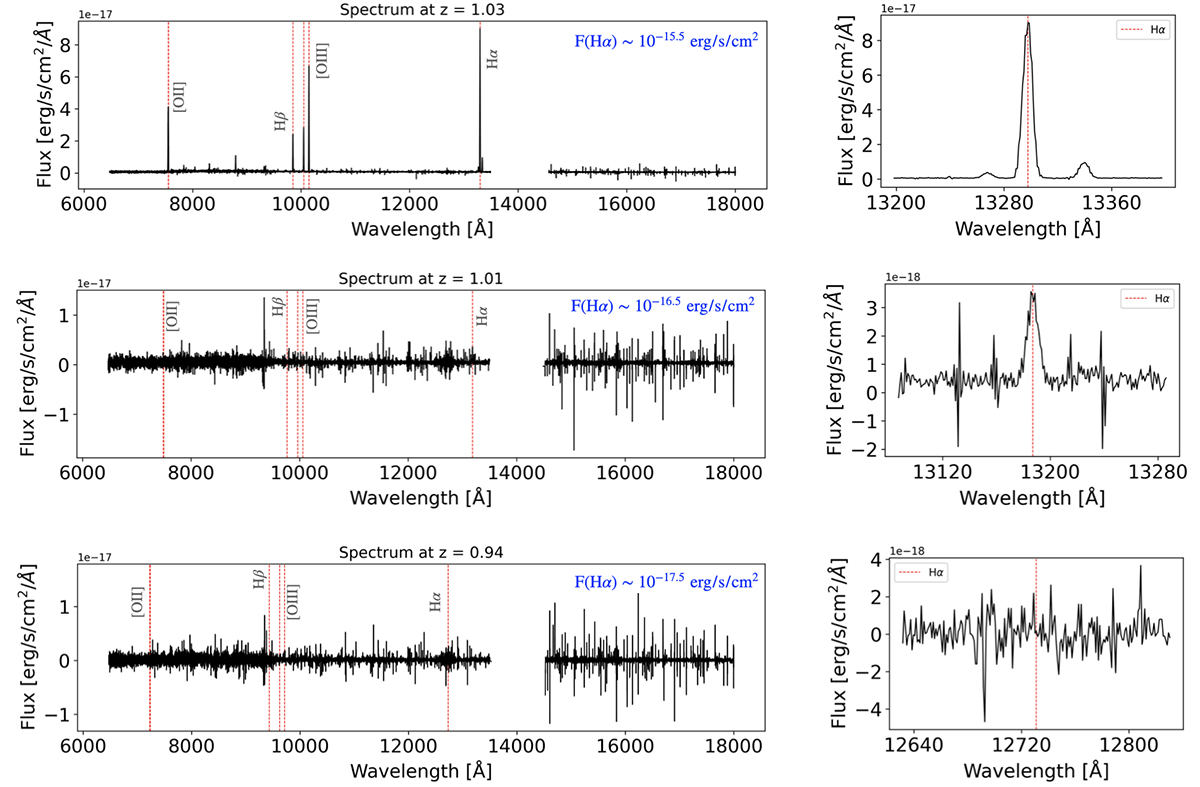
Examples of simulated galaxy spectra from our sample, shown before any pre-processing required for input into our pipeline, covering the entire spectral range. Each row represents a different galaxy spectrum, with the left panels showing the full spectrum and the right panels providing a zoomed-in view around the Hα line. The spectra are positioned based on the Hα line flux: F(Hα) ∼ 10−15 erg/s/cm2 (upper row), F(Hα) ∼ 10−16.5 erg/s/cm2 (middle row), and F(Hα) ∼ 10−17.5 erg/s/cm2 (lower row), representing high-, average-, and low-quality spectra, respectively. Red vertical lines indicate the positions of key emission lines, including [OII], Hβ, [OIII], and Hα, with corresponding labels. The missing flux values around 14 000 Å are due to the gap between spectral bands (see Sect. 2).
Current usage metrics show cumulative count of Article Views (full-text article views including HTML views, PDF and ePub downloads, according to the available data) and Abstracts Views on Vision4Press platform.
Data correspond to usage on the plateform after 2015. The current usage metrics is available 48-96 hours after online publication and is updated daily on week days.
Initial download of the metrics may take a while.