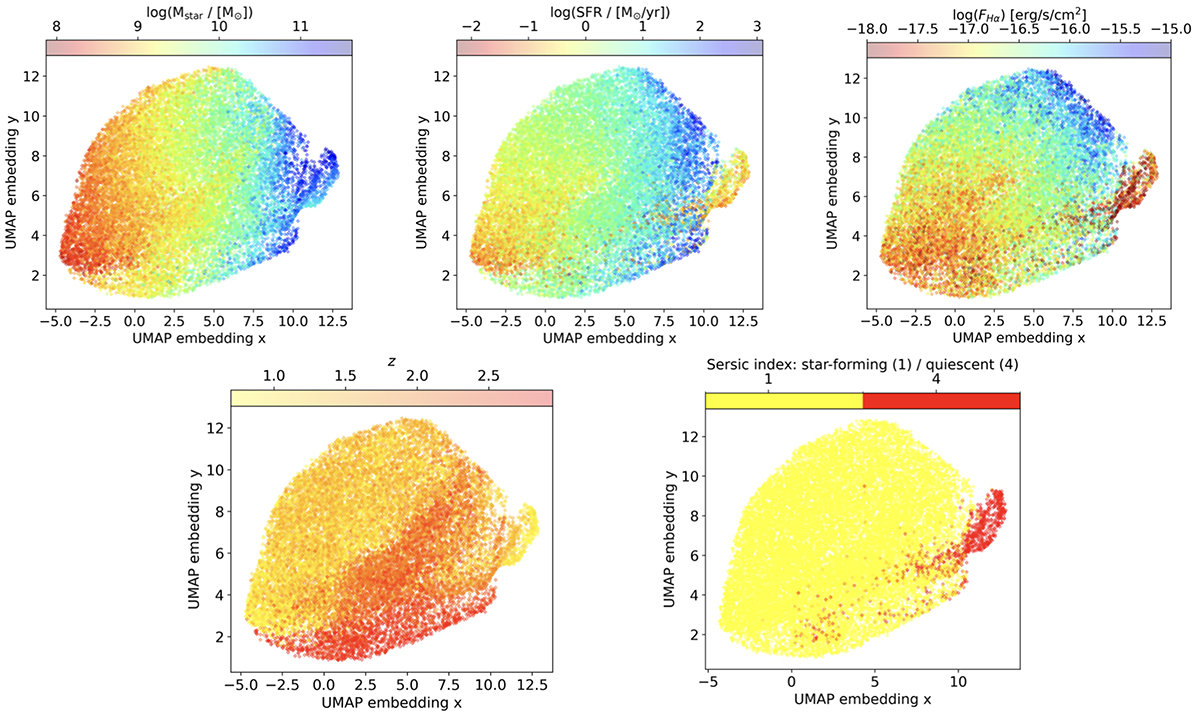
Fig. 13.
Download original image
UMAP-reduced 2D visualisations of the concatenated dense layers following the ‘shared info’ layer in M-TOPnet (see Figure 3 and a discussion in Sect. 5). Each panel shows the embedding space colour-coded by different parameters: from left to right, Mstar, SFR, Hα flux (upper panels) and redshift and Sérsic index (lower panels), which differentiates between star-forming galaxies (Sérsic index = 1) and quiescent galaxies (Sérsic index = 4).
Current usage metrics show cumulative count of Article Views (full-text article views including HTML views, PDF and ePub downloads, according to the available data) and Abstracts Views on Vision4Press platform.
Data correspond to usage on the plateform after 2015. The current usage metrics is available 48-96 hours after online publication and is updated daily on week days.
Initial download of the metrics may take a while.