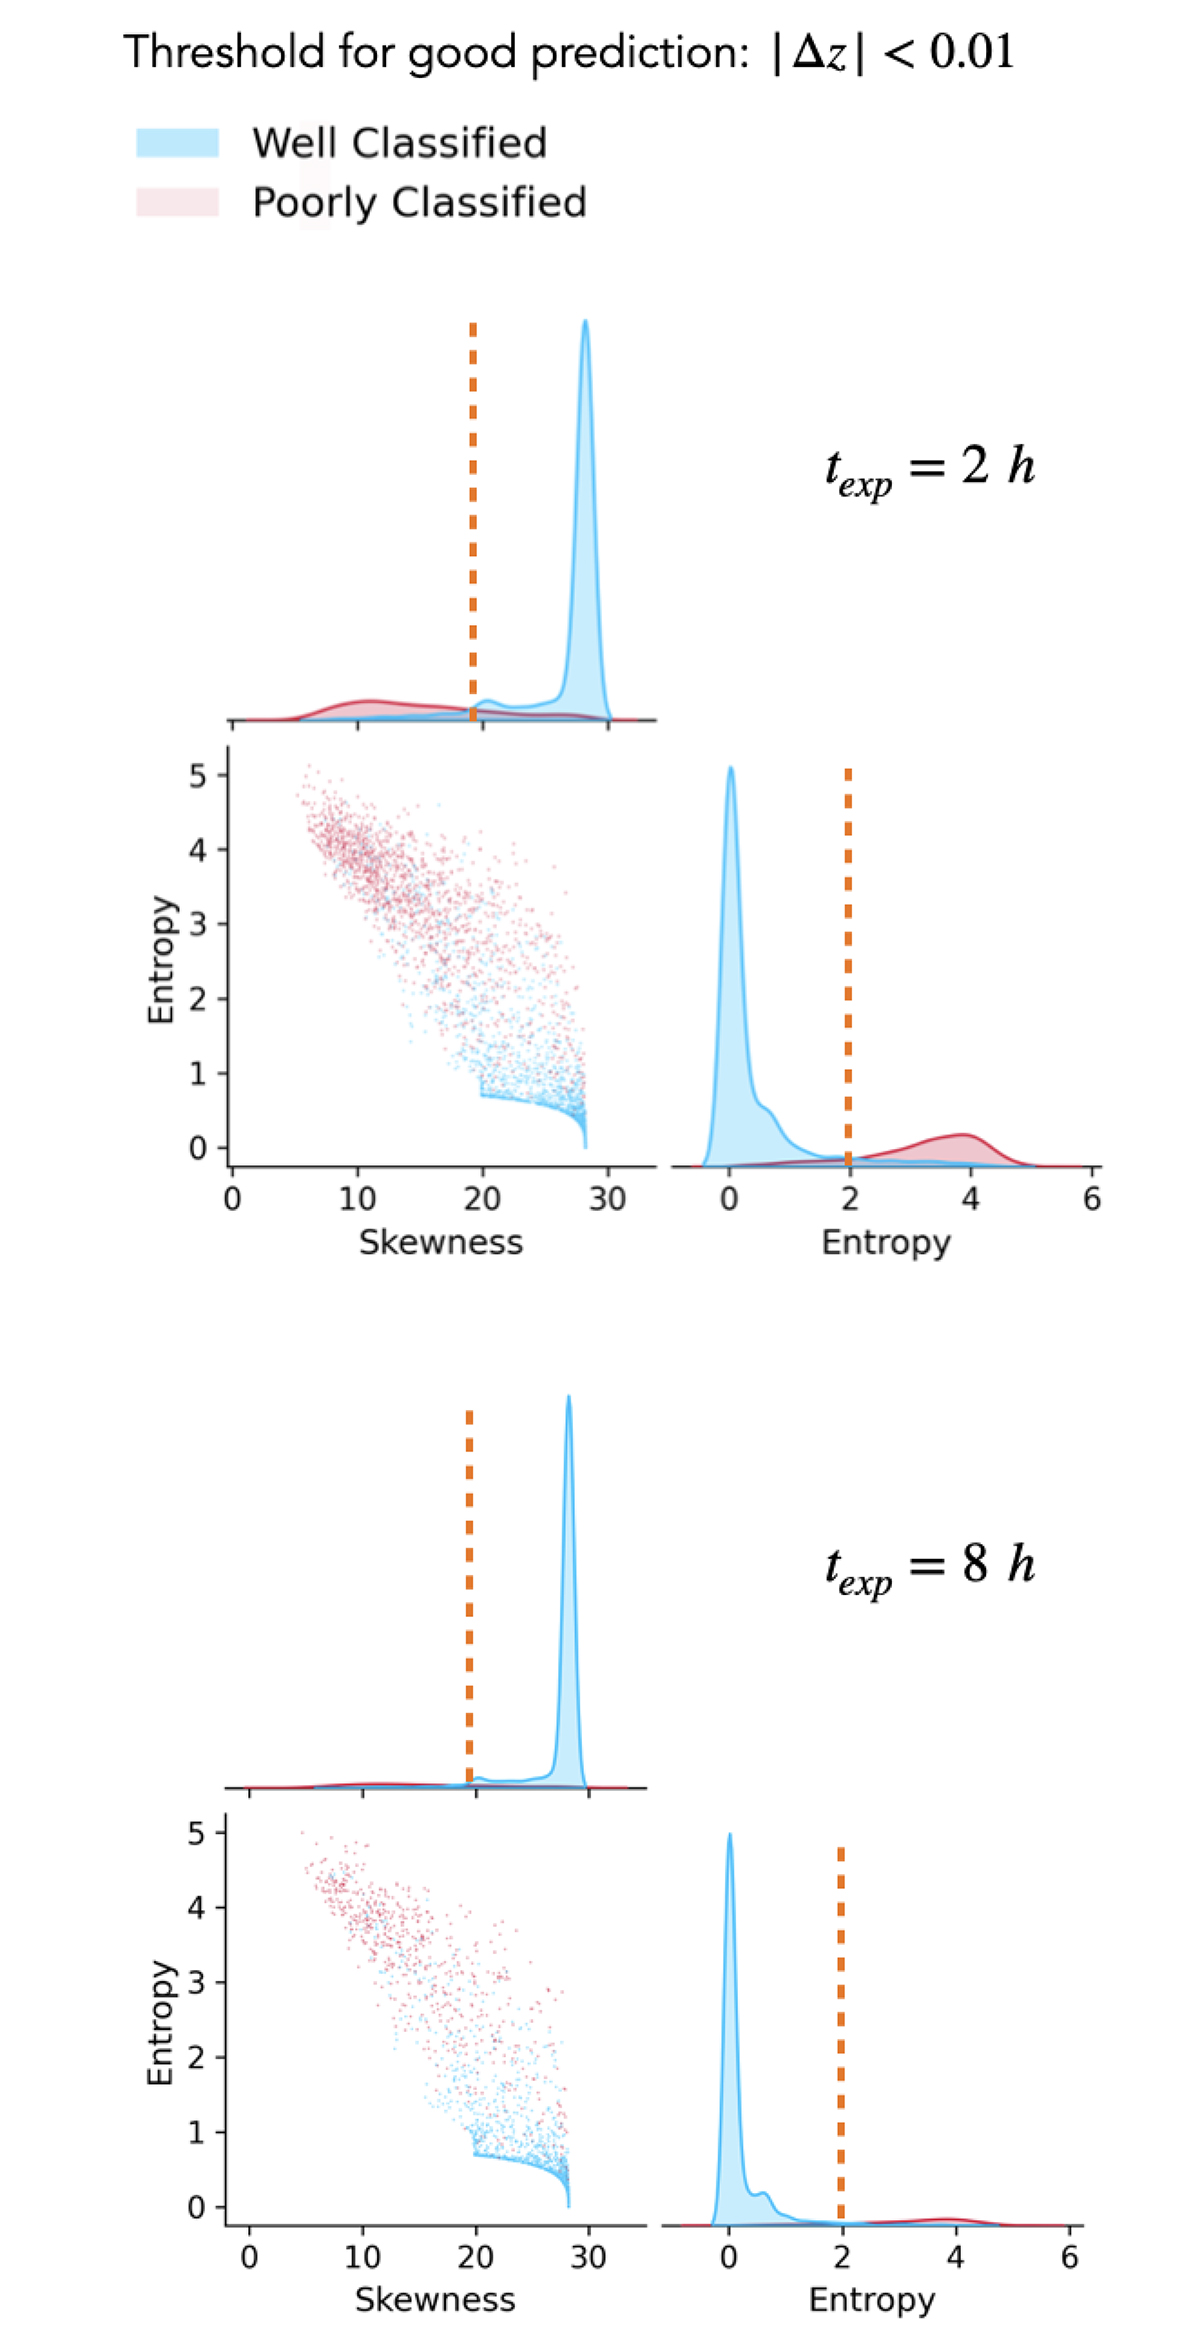
Fig. 12.
Download original image
Corner plots showing the distributions and mutual relations of skewness and entropy of redshift PDFs for well-classified (blue) and poorly classified (red) galaxy spectra. The threshold for a good prediction is set at |Δz|< 0.01. Top panel: Results for spectra with an exposure time of texp = 2 h. Bottom panel: Results for spectra with texp = 8 h. Well-classified spectra and poorly classified spectra are clearly distinguished by their skewness and entropy values (see a discussion in Sect. 5). The vertical orange lines indicate the separation threshold for skewness = 20 and entropy = 2.
Current usage metrics show cumulative count of Article Views (full-text article views including HTML views, PDF and ePub downloads, according to the available data) and Abstracts Views on Vision4Press platform.
Data correspond to usage on the plateform after 2015. The current usage metrics is available 48-96 hours after online publication and is updated daily on week days.
Initial download of the metrics may take a while.