Fig. 11.
Download original image
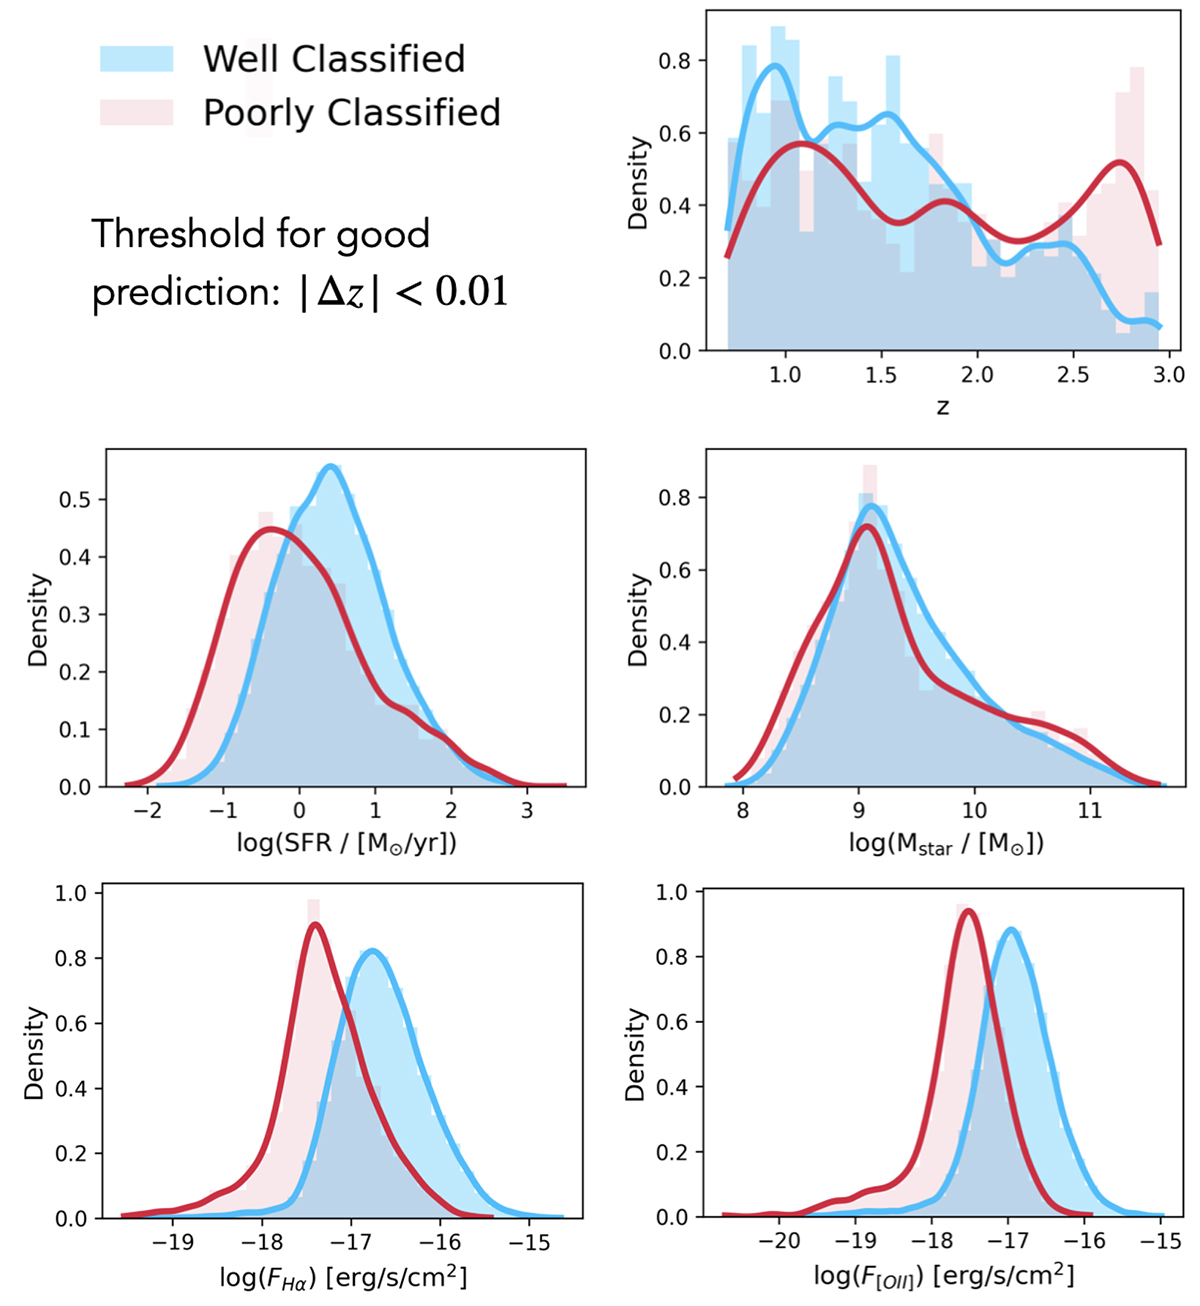
Normalised distributions of well-classified (blue) and poorly classified (red) galaxy spectra based on various parameters (see Sect. 5 for a discussion). Top left to bottom right: Distributions as a function of redshift (z), SFR, stellar mass (Mstar), and fluxes of Hα and [OIII] emission lines. The threshold for a good prediction is set at |Δz|< 0.01.
Current usage metrics show cumulative count of Article Views (full-text article views including HTML views, PDF and ePub downloads, according to the available data) and Abstracts Views on Vision4Press platform.
Data correspond to usage on the plateform after 2015. The current usage metrics is available 48-96 hours after online publication and is updated daily on week days.
Initial download of the metrics may take a while.