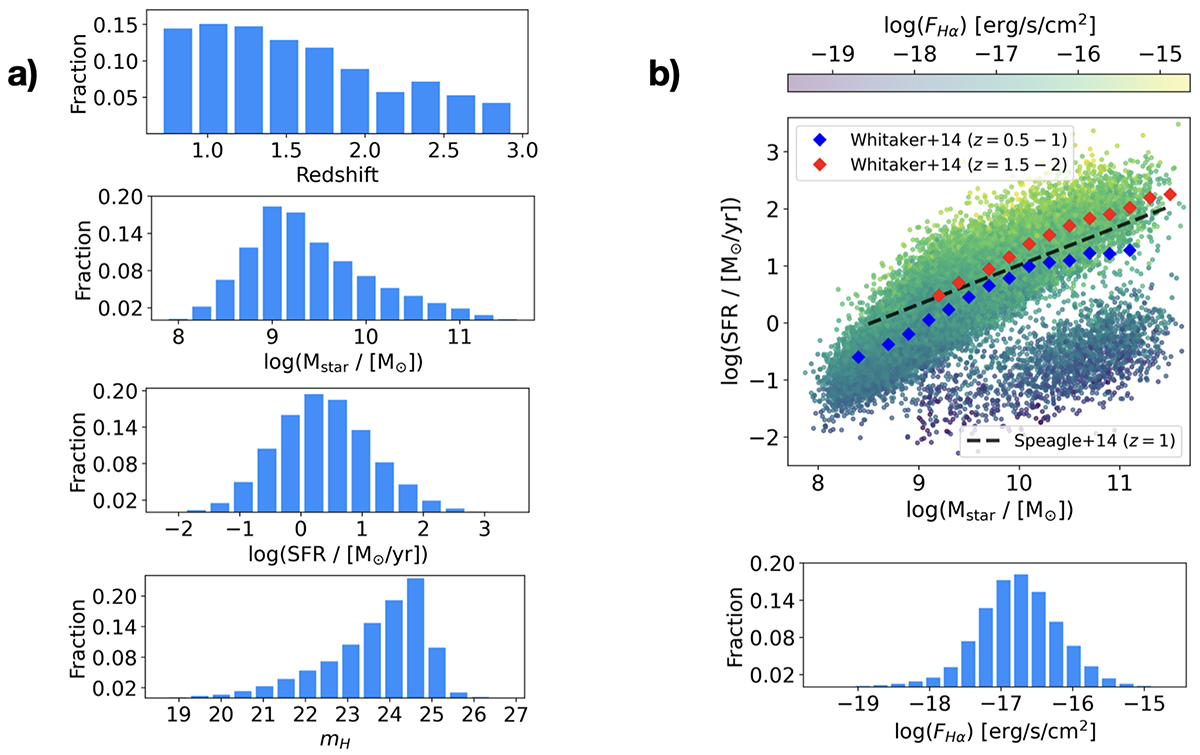
Fig. 1.
Download original image
Properties of galaxies in the simulated dataset. (a) Distributions of key galaxy properties, including redshift (first panel), Mstar (second panel), SFR (third panel), and mH (bottom panel), arranged from top to bottom. (b) Upper panel: Distribution of galaxies in the log(Mstar) versus log(SFR) diagram, highlighting their representation of both main-sequence star-forming galaxies and passive galaxies. Galaxies are colour-coded by their Hα line flux. For reference, we show the trends of the main sequence at z = 0.5 − 1 (blue points) and at z = 1.5 − 2 (red points) reported by Whitaker et al. (2014), and the best fit for the main sequence at z ∼ 1 by Speagle et al. (2014). Lower panel: flux distribution of the Hα line.
Current usage metrics show cumulative count of Article Views (full-text article views including HTML views, PDF and ePub downloads, according to the available data) and Abstracts Views on Vision4Press platform.
Data correspond to usage on the plateform after 2015. The current usage metrics is available 48-96 hours after online publication and is updated daily on week days.
Initial download of the metrics may take a while.