| Issue |
A&A
Volume 693, January 2025
|
|
|---|---|---|
| Article Number | A214 | |
| Number of page(s) | 5 | |
| Section | Stellar atmospheres | |
| DOI | https://doi.org/10.1051/0004-6361/202452683 | |
| Published online | 17 January 2025 | |
Gaia vbroad: Spectral-line broadening and binarity
1
School of Physics and Astronomy, Tel Aviv University,
Tel Aviv
6997801,
Israel
2
Leiden Observatory, Leiden University,
Einsteinweg 55,
2333 CC
Leiden,
The Netherlands
★ Corresponding authors; This email address is being protected from spambots. You need JavaScript enabled to view it.
; This email address is being protected from spambots. You need JavaScript enabled to view it.
Received:
21
October
2024
Accepted:
6
December
2024
Abstract
The Gaia DR3 catalogue includes line-broadening measurements (vbroad) for 3 524 677 stars. We concentrate here on the low-mass main-sequence (MS) sub-sample of the catalogue, with (GBP − GRP)0 in the range of 1–1.6, which includes 81 371 sources. The colour-magnitude diagram of the sample displays two distinct strips, the brighter of which is probably mostly composed of unresolved binaries, with mass ratios close to unity. We show that the suspected binary sub-sample displays a larger vbroad distribution, which we attribute to the unresolved absorption lines of the two components of each binary. A similar effect is seen in the GALAH data.
Key words: astronomical databases: miscellaneous / binaries: close
© The Authors 2025
 Open Access article, published by EDP Sciences, under the terms of the Creative Commons Attribution License (https://creativecommons.org/licenses/by/4.0), which permits unrestricted use, distribution, and reproduction in any medium, provided the original work is properly cited.
This article is published in open access under the Subscribe to Open model. This email address is being protected from spambots. You need JavaScript enabled to view it. to support open access publication.
1 Introduction
The Gaia space mission (Gaia Collaboration 2016) carries a spectrometer with intermediate resolving power, R ≈ 11 500, covering the 846–870 nm range, with the primary goal of measuring the radial velocity (RV) of bright sources (Cropper et al. 2018)1, down to magnitude Grvs ~ 16 (Katz et al. 2023). The spectroscopic pipeline (Sartoretti et al. 2018) also derives a line-broadening parameter that estimates the broadening of the absorption lines relative to the pertinent template, yielding for Gaia Data Release 3 (DR3) (Gaia Collaboration 2023b) line-broadening measurement (vbroad) values for 3 524677 sources (Frémat et al. 2023)2.
Despite the relatively low resolution of the spectrograph, the vbroad values can be used to estimate the stellar rotational broadening (e.g. Gilhool & Blake 2019), as discussed by Frémat et al. (2023), which in turn can help us estimate the stellar rotational period, if we know the stellar radius (e.g. Kiman et al. 2024) and the rotational axis inclination. Stellar rotation has in recent years been derived from the observed photometric modulation (e.g. McQuillan et al. 2014; Iwanek et al. 2024; Ramsay et al. 2024), utilizing large photometric surveys, which provides astrophysical information for different types of stars (e.g. Buder et al. 2021; Xiang et al. 2022). The vbroad database is another independent, albeit less accurate, avenue to obtain stellar rotation periods.
Another large sample of stellar broadening is included in the GALactic Archaeology with HERMES (GALAH) DR3 database (Buder et al. 2021), based on observations of the Hydrogen Epoch of Reionization Array MEasurement of Spin (HERMES) spectrometer mounted on the Anglo-Australian Telescope (AAT). The vbroad, given for 581 149 sources3, is one of its stellar parameters. With HERMES, the AAT achieves a median spectral resolution of 28 000 and thus creates a sample that surpasses Gaia’s quality. HERMES covers a non-contiguous range of 1000 Å, spanning across the blue (4713–4903 Å), green (5648–5873 Å), red (6478–6737 Å), and infrared (7585–7887 Å) wavelengths. vbroad values are provided for sources up to V ~ 20, 92% of which are brighter than V = 14 (Barden et al. 2010; Heijmans et al. 2012; Farrell et al. 2014; Sheinis et al. 2015).
We studied the impact of the binarity of the main-sequence (MS) Gaia sources on the derived line width (i.e. the vbroad). We identified the binaries by their brightness excess relative to their colour on the Gaia colour-magnitude diagram (CMD; e.g. Donada et al. 2023; Wallace 2024). Kovalev et al. (2024, 2022) used a somewhat similar approach, identifying ~104 double-lined spectroscopic binary (SB2) candidates in Large Sky Area Multi-Object Fiber Spectroscopic Telescope (LAMOST) spectra by their larger rotational velocity values.
In Sect. 2 we demonstrate that the sample of late MS Gaia sources with derived vbroad values displays two strips. The upper strip is mostly composed of unresolved binaries with relatively luminous secondaries and displays a significantly larger vbroad distribution. In Sect. 3 we repeat the analysis for a sample of stars with GALAH vbroad values and obtain similar results. In Sect. 4 we discuss our findings and present our conclusions.
2 Identifying two CMD strips in late-type MS Gaia stars with vbroad values
Out of the original vbroad sample, which consists of 3 524 677 sources, we considered only sources with ϖ > 0 and σϖ/ϖ < 10%. This left us with 3 238 383 sources, of which we only considered those with given extinction coefficients. This further reduces our population size to 1 834 196.
To focus on the late MS stars of the sample, we considered a further restricted sample of stars whose extinction-corrected colour (GBP − GRP)0 was in the range 1–1.6 and extinction-corrected absolute G magnitude (MG,0) values in the range 4–8. This left us with 81 371 stars, which are plotted in Fig. 1 and colour-coded by their vbroad values. The diagram clearly displays two parallel strips; the upper strip displays larger vbroad values. This strip is probably composed cf unresolved binaries (Freund et al. 2024; Phillips et al. 2024; Wallace 2024) that are more luminous than their primaries due to the brightness contribution of their secondaries.
To show that this is indeed the case, we simulated the CMD location of binary systems with solar metallicites and ages of 4.5 Gyr with different mass ratios using the PARSEC4 (e.g. Bressan et al. 2012; Chen et al. 2014; Tang et al. 2014; Marigo et al. 2017) tracks (see Fig. 1 of Wallace 2024). Figure 2 seems to support the binary hypothesis, suggesting the upper strip is composed of unresolved binaries with q ≳ 0.7.
Coefficients of the Gaussian mixture.
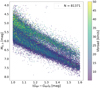 |
Fig. 1 Our vbroad sample for sources with given extinction coefficients ϖ > 0, σϖ/ϖ < 10%, (GBP − GRP)0 ∈ [1,1.6], and MG,0 ∈ [4,8], colour-coded by vbroad values. The 215 sources with vbroad well above 50 km/s are rounded down to 50 km/s for the colour coding; of these, 204 are located on the upper strip. |
2.1 Separating the binaries from the single stars
To identify the separation between the two populations, we split the (GBP − GRP)0 range into six bins of 0.1 mag each and plot in Fig. 3 the MG,0 histogram for each bin. Each of the six histograms resembles a mixture of two Gaussians, corresponding to the lower and upper strips.
For each histogram, we fitted a two-Gaussians mixture5 and defined the separation between the two populations as the intersection of the two Gaussians. Table 1 lists for each (GBP − GRP)0 bin the parameters of the two Gaussians and the MG,0 separation. We note that this splitting between single and binary stars is based only on their CMD location; the vbroad values are not taken into consideration.
Positioning the six points of separation in the middle of their respective bins, we fitted a second-degree polynomial that separates the two strips, as shown in Fig. 2.
The vbroad values of the two populations are displayed in Fig. 4 as a function of the MG,0 for the six colour bins. The figure distinctively shows a more extended vbroad distribution for the binaries. The different distributions are presented as violin plots in Fig. 5.
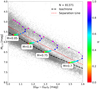 |
Fig. 2 Same as Fig. 1 but over-plotted with isochrones with an age of 4.5 Gyr and metallicity [Fe/H] = 0. Four primary masses (0.7, 0.75, 0.8, 0.85 solar mass) are positioned on the isochrone. For each isochrone, binaries of different mass ratios are simulated and colour-coded by their mass ratio, q. The binaries with q = 1 appear on the upper strip, positioned 0. 752 magnitudes above their lower-strip single primaries. Isochrones are derived from the PARSEC models (see the main text). The red line separates the two strips; the line equation is −0.44 × x2 + 4.3 × x + 1.37. It is generated based purely on the MG,0 histograms, as explained in Section 2.1. For a similar simulation, see Fig. 1 in Wallace (2024). |
2.2 Comparison with Gaia DR3 multiple star classifier
It is interesting to compare our binary identification against other indications of binarity. One such indicator is the multiple star classifier (MSC), which infers stellar parameters for bright sources from low-resolution BP/RP spectra and parallaxes, under the assumption that each of these sources is an unresolved coeval binary system. MSC analysis results in a logposterior_msc parameter6 that signifies how likely it is that a system is a binary.
Table 2 compares the logposterior quartiles of the two strips. The values for the upper strip are remarkably higher than for the lower, indicating higher probabilities of binarity. This supports our conjecture.
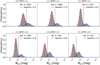 |
Fig. 3 Histograms of MG,0 per (GBP − GRP)0 bin. |
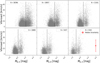 |
Fig. 4 vbroad vs MG,0. For visual clarity, only vbroad<50 km/s sources are shown. The bottom-right panel shows an artificial point marking the median uncertainty of the sample. |
3 GALAH vbroad
We applied our analysis to a different, more accurate, dataset from GALAH Buder et al. (2021), whose DR3 contains 588 571 sources, of which 588 464 have Gaia source_id. After matching based on source_id, we applied the same filters as described in Section 2: ϖ > 0 and σϖ/ϖ < 10%. These critera left us with 422 785 stars. Now zooming into our two-strip area, (Gbp − Grp)0 ∈ [1,1.6] and MG,0 ∈ [4,8], left us with 32675 sources. Out of these, 32 430 have GALAH vbroad values (4529 also have Gaia vbroad values).
In this paper we only present the main figures from the GALAH analysis. Figure 6 shows the two strips, over-plotted with GALAH separating line together with the original Gaia line; the two are very similar. Figure 7 presents the violin plots, again showing close similarity with the Gaia data (presented in Fig. 5). The logPosterior_MSC analysis gave similar results.
Comparison of the logposterior binary indicator for the lower and upper strip.
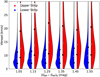 |
Fig. 5 Violin plot for the Gaia vbroad values, divided by colour bin and by strip (upper vs lower), vbroad is capped here at 30 km/s for visual clarity; the upper-strip distribution is elongated and extended towards higher vbroad values than the lower one. Two black dots on each violin represent the 25th and 75th percentiles; the grey dots mark the median. |
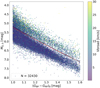 |
Fig. 6 Same as Fig. 1 but for the GALAH vbroad population. The equation for the black line is y = −0.314 × x2 + 4.070 × x + 1.422. The red line is the separation derived for the original population, over-plotted here for comparison. The 411 sources with vbroad above 30 km/s were rounded down to that value; of these, 242 are on the upper strip. |
3.1 Example of GALAH spectra with different vbroad
Figure 8 shows an example of four GALAH spectra from the Hα-line region for sources with similar colour temperatures (5080-5220 K, taken from teff_gspphot7). Two of the sources, which are twice as bright as the other two, are suspected binaries, with vbroad values that are much larger than those of the two single stars. One can see that the Hα line is split in those two spectra, for the ID= 140314002601323 source in particular, consistent with the binary conjecture.
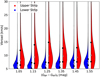 |
Fig. 7 Same as Fig. 5 but for GALAH’s vbroad. vbroad is limited to 5–30 km/s for visual clarity. A similar trend is seen in the upper and lower strips. Two black dots on each violin represent the 25th and 75th percentiles; the grey dot marks the median. |
4 Discussion
This study considered 81371 late-type MS Gaia sources with derived vbroad values, the CMD of which displays a two-strip structure, as noted by Freund et al. (2024), Phillips et al. (2024) and Wallace (2024). The objects on the upper strip, identified by their MG,0 excess, show a higher vbroad distribution. Very similar behaviour is seen in the GALAH data.
We have shown that many of the upper-strip stars are composed of unresolved binaries, by simulating isochrones of binaries with different mass ratios. The simulations show that, regardless of the colour, the upper strip includes binaries with mass ratios larger than about 0.7.
The vbroad derivation is based on the Gaia RVS relatively low-resolution spectra, and therefore the vbroad values are usually associated with large uncertainties (Frémat et al. 2023). Nevertheless, we were able to identify the binary effect on these values with high significance, thanks to the large number of sources available for analysis.
We suggest that the larger vbroad values of many of the unresolved binaries originate from the presence of the lines of the secondary star in the spectra of those binaries. The RVs of the two components of the binary systems are separated by their orbital motion, but cannot be resolved by the RVS spectra. Therefore, the vbroad pipeline measures a larger line width. Obviously, the RV difference between the two components depends on the orbital period and the binary inclination and phase at the time of each measurement, parameters that are not available. Nevertheless, the additional component widens the line profile and consequently the vbroad estimation of the unresolved binaries.
The vbroad excess of the unresolved binaries is of the order of 10 km/s. For a binary with a total mass of 1 M⊙, a relative velocity of ~10 km/s indicates an orbital period of ~30 years and ~10 au, assuming an orbital inclination close to 90°. Such a binary was impossible to detect as an astrometric binary in Gaia DR3 (e.g. Gaia Collaboration 2023a), nor can it be resolved by Gaia (e.g. Castro-Ginard et al. 2024). Gaia Collaboration (2023a) classified 12% of the upper-strip sources and only 4% of the lower-strip sources as binaries, which supports our hypothesis that there is a high frequency of binarity in the upper strip.
We note that ~20% of the Gaia and GALAH vbroad sources are on the upper strip. Assuming a high frequency of binaries in these upper strips is consistent with the estimation that about 50% of 0.1–1 M⊙ stars are members of multiple-star systems (e.g. Raghavan et al. 2010; Duchêne & Kraus 2013; Moe & Di Stefano 2017), taking into account that only unresolved high mass-ratio binaries reside on the upper strip.
In the future, one will be able to detect an increasing number of these binaries as Gaia astrometric binaries, as the observational time span of the space mission increases. Further, with the TODCOR technique (Zucker & Mazeh 1994), one could try to identify the secondary spectrum in the RVS spectrum, as was done for the GALAH project (Traven et al. 2020), or in the Gaia BP/RP spectra (Andrae et al. 2023). These analyses will provide us with a better understanding of the true characteristics of the binary population of late-type stars.
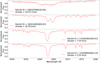 |
Fig. 8 GALAH spectra for four sources, two from the upper strip (MG,0 = 4.74 for both) and two from the lower one, with brightnesses (MG,0) of 5.49 and 5.50, respectively. The colour of the sources is (GBP − GRP)0 = 1.00–1.01. The brighter sources show much broader absorption lines. |
Acknowledgements
We are indebted to the referee for thoughtful advice that significantly improved the previous version of the paper. This work has made use of data from the European Space Agency (ESA) mission Gaia (https://www.cosmos.esa.int/gaia), processed by the Gaia Data Processing and Analysis Consortium (DPAC, https://www.cosmos.esa.int/web/gaia/dpac/consortium). Funding for the DPAC has been provided by national institutions, in particular, the institutions participating in the Gaia Multilateral Agreement. This work also made use of the Third Data Release of the GALAH Survey (Buder et al. 2021). The GALAH Survey is based on data acquired through the Australian Astronomical Observatory, under programs: A/2013B/13 (The GALAH pilot survey); A/2014A/25, A/2015A/19, A2017A/18 (The GALAH survey phase (1); A2018A/18 (Open clusters with HERMES); A2019A/1 (Hierarchical starformation in Ori OB1); A2019A/15 (The GALAH survey phase (2); A/2015B/19, A/2016A/22, A/2016B/10, A/2017B/16, A/2018B/15 (The HERMES-TESS program); and A/2015A/3, A/2015B/1, A/2015B/19, A/2016A/22, A/2016B/12, A 2017A 14 (The HERMES K2-follow-up program). We acknowledge the traditional owners of the land on which the AAT stands, the Gamilaraay people, and pay our respects to elders past and present. This paper includes data that has been provided by AAO Data Central (datacentral.org.au). We are indebted to the Gaia CU6 team that released the vbroad values for such a large sample, enabling this study.
References
- Andrae, R., Fouesneau, M., Sordo, R., et al. 2023, A&A, 674, A27 [CrossRef] [EDP Sciences] [Google Scholar]
- Barden, S. C., Jones, D. J., Barnes, S. I., et al. 2010, SPIE Conf. Ser., 7735, 773509 [NASA ADS] [Google Scholar]
- Bressan, A., Marigo, P., Girardi, L., et al. 2012, MNRAS, 427, 127 [NASA ADS] [CrossRef] [Google Scholar]
- Buder, S., Sharma, S., Kos, J., et al. 2021, MNRAS, 506, 150 [NASA ADS] [CrossRef] [Google Scholar]
- Castro-Ginard, A., Penoyre, Z., Casey, A. R., et al. 2024, A&A, 688, A1 [NASA ADS] [CrossRef] [EDP Sciences] [Google Scholar]
- Chen, Y. P., Trager, S. C., Peletier, R. F., et al. 2014, The Messenger, 158, 30 [NASA ADS] [Google Scholar]
- Cropper, M., Katz, D., Sartoretti, P., et al. 2018, A&A, 616, A5 [NASA ADS] [CrossRef] [EDP Sciences] [Google Scholar]
- Donada, J., Anders, F., Jordi, C., et al. 2023, A&A, 675, A89 [NASA ADS] [CrossRef] [EDP Sciences] [Google Scholar]
- Duchêne, G., & Kraus, A. 2013, ARA&A, 51, 269 [Google Scholar]
- Farrell, T. J., Birchall, M. N., Heald, R. W., et al. 2014, SPIE Conf. Ser., 9152, 915223 [NASA ADS] [Google Scholar]
- Frémat, Y., Royer, F., Marchal, O., et al. 2023, A&A, 674, A8 [NASA ADS] [CrossRef] [EDP Sciences] [Google Scholar]
- Freund, S., Czesla, S., Predehl, P., et al. 2024, A&A, 684, A121 [NASA ADS] [CrossRef] [EDP Sciences] [Google Scholar]
- Gaia Collaboration (Prusti, T., et al.) 2016, A&A, 595, A1 [NASA ADS] [CrossRef] [EDP Sciences] [Google Scholar]
- Gaia Collaboration (Arenou, F., et al.) 2023a, A&A, 674, A34 [CrossRef] [EDP Sciences] [Google Scholar]
- Gaia Collaboration (Vallenari, A., et al.) 2023b, A&A, 674, A1 [NASA ADS] [CrossRef] [EDP Sciences] [Google Scholar]
- Gilhool, S. H., & Blake, C. H. 2019, ApJ, 875, 8 [NASA ADS] [CrossRef] [Google Scholar]
- Heijmans, J., Asplund, M., Barden, S., et al. 2012, SPIE Conf. Ser., 8446, 84460W [NASA ADS] [Google Scholar]
- Iwanek, P., Soszynski, I., Stepien, K., et al. 2024, Acta Astron., 74, 1 [NASA ADS] [Google Scholar]
- Katz, D., Sartoretti, P., Guerrier, A., et al. 2023, A&A, 674, A5 [NASA ADS] [CrossRef] [EDP Sciences] [Google Scholar]
- Kiman, R., Brandt, T. D., Faherty, J. K., & Popinchalk, M. 2024, AJ, 168, 126 [Google Scholar]
- Kovalev, M., Chen, X., & Han, Z. 2022, MNRAS, 517, 356 [NASA ADS] [CrossRef] [Google Scholar]
- Kovalev, M., Zhou, Z., Chen, X., & Han, Z. 2024, MNRAS, 527, 521 [Google Scholar]
- Marigo, P., Girardi, L., Bressan, A., et al. 2017, ApJ, 835, 77 [Google Scholar]
- McQuillan, A., Mazeh, T., & Aigrain, S. 2014, ApJS, 211, 24 [Google Scholar]
- Moe, M., & Di Stefano, R. 2017, ApJS, 230, 15 [Google Scholar]
- Phillips, A., Kochanek, C. S., Jayasinghe, T., et al. 2024, MNRAS, 527, 5588 [Google Scholar]
- Raghavan, D., McAlister, H. A., Henry, T. J., et al. 2010, ApJS, 190, 1 [Google Scholar]
- Ramsay, G., Hakala, P., & Gerry Doyle, J. 2024, A&A, 689, A288 [NASA ADS] [CrossRef] [EDP Sciences] [Google Scholar]
- Sartoretti, P., Katz, D., Cropper, M., et al. 2018, A&A, 616, A6 [NASA ADS] [CrossRef] [EDP Sciences] [Google Scholar]
- Sheinis, A., Anguiano, B., Asplund, M., et al. 2015, J. Astron. Teles. Instrum. Syst., 1, 035002 [NASA ADS] [CrossRef] [Google Scholar]
- Tang, J., Bressan, A., Rosenfield, P., et al. 2014, MNRAS, 445, 4287 [NASA ADS] [CrossRef] [Google Scholar]
- Traven, G., Feltzing, S., Merle, T., et al. 2020, A&A, 638, A145 [NASA ADS] [CrossRef] [EDP Sciences] [Google Scholar]
- Wallace, A. L. 2024, MNRAS, 527, 8718 [Google Scholar]
- Xiang, M., Rix, H.-W., Ting, Y.-S., et al. 2022, A&A, 662, A66 [NASA ADS] [CrossRef] [EDP Sciences] [Google Scholar]
- Zucker, S., & Mazeh, T. 1994, ApJ, 420, 806 [NASA ADS] [CrossRef] [Google Scholar]
CMD 3.7: http://stev.oapd.inaf.it/cgi-bin/cmd
All Tables
All Figures
|
Fig. 1 Our vbroad sample for sources with given extinction coefficients ϖ > 0, σϖ/ϖ < 10%, (GBP − GRP)0 ∈ [1,1.6], and MG,0 ∈ [4,8], colour-coded by vbroad values. The 215 sources with vbroad well above 50 km/s are rounded down to 50 km/s for the colour coding; of these, 204 are located on the upper strip. |
| In the text | |
|
Fig. 2 Same as Fig. 1 but over-plotted with isochrones with an age of 4.5 Gyr and metallicity [Fe/H] = 0. Four primary masses (0.7, 0.75, 0.8, 0.85 solar mass) are positioned on the isochrone. For each isochrone, binaries of different mass ratios are simulated and colour-coded by their mass ratio, q. The binaries with q = 1 appear on the upper strip, positioned 0. 752 magnitudes above their lower-strip single primaries. Isochrones are derived from the PARSEC models (see the main text). The red line separates the two strips; the line equation is −0.44 × x2 + 4.3 × x + 1.37. It is generated based purely on the MG,0 histograms, as explained in Section 2.1. For a similar simulation, see Fig. 1 in Wallace (2024). |
| In the text | |
|
Fig. 3 Histograms of MG,0 per (GBP − GRP)0 bin. |
| In the text | |
|
Fig. 4 vbroad vs MG,0. For visual clarity, only vbroad<50 km/s sources are shown. The bottom-right panel shows an artificial point marking the median uncertainty of the sample. |
| In the text | |
|
Fig. 5 Violin plot for the Gaia vbroad values, divided by colour bin and by strip (upper vs lower), vbroad is capped here at 30 km/s for visual clarity; the upper-strip distribution is elongated and extended towards higher vbroad values than the lower one. Two black dots on each violin represent the 25th and 75th percentiles; the grey dots mark the median. |
| In the text | |
|
Fig. 6 Same as Fig. 1 but for the GALAH vbroad population. The equation for the black line is y = −0.314 × x2 + 4.070 × x + 1.422. The red line is the separation derived for the original population, over-plotted here for comparison. The 411 sources with vbroad above 30 km/s were rounded down to that value; of these, 242 are on the upper strip. |
| In the text | |
|
Fig. 7 Same as Fig. 5 but for GALAH’s vbroad. vbroad is limited to 5–30 km/s for visual clarity. A similar trend is seen in the upper and lower strips. Two black dots on each violin represent the 25th and 75th percentiles; the grey dot marks the median. |
| In the text | |
|
Fig. 8 GALAH spectra for four sources, two from the upper strip (MG,0 = 4.74 for both) and two from the lower one, with brightnesses (MG,0) of 5.49 and 5.50, respectively. The colour of the sources is (GBP − GRP)0 = 1.00–1.01. The brighter sources show much broader absorption lines. |
| In the text | |
Current usage metrics show cumulative count of Article Views (full-text article views including HTML views, PDF and ePub downloads, according to the available data) and Abstracts Views on Vision4Press platform.
Data correspond to usage on the plateform after 2015. The current usage metrics is available 48-96 hours after online publication and is updated daily on week days.
Initial download of the metrics may take a while.