Fig. 5
Download original image
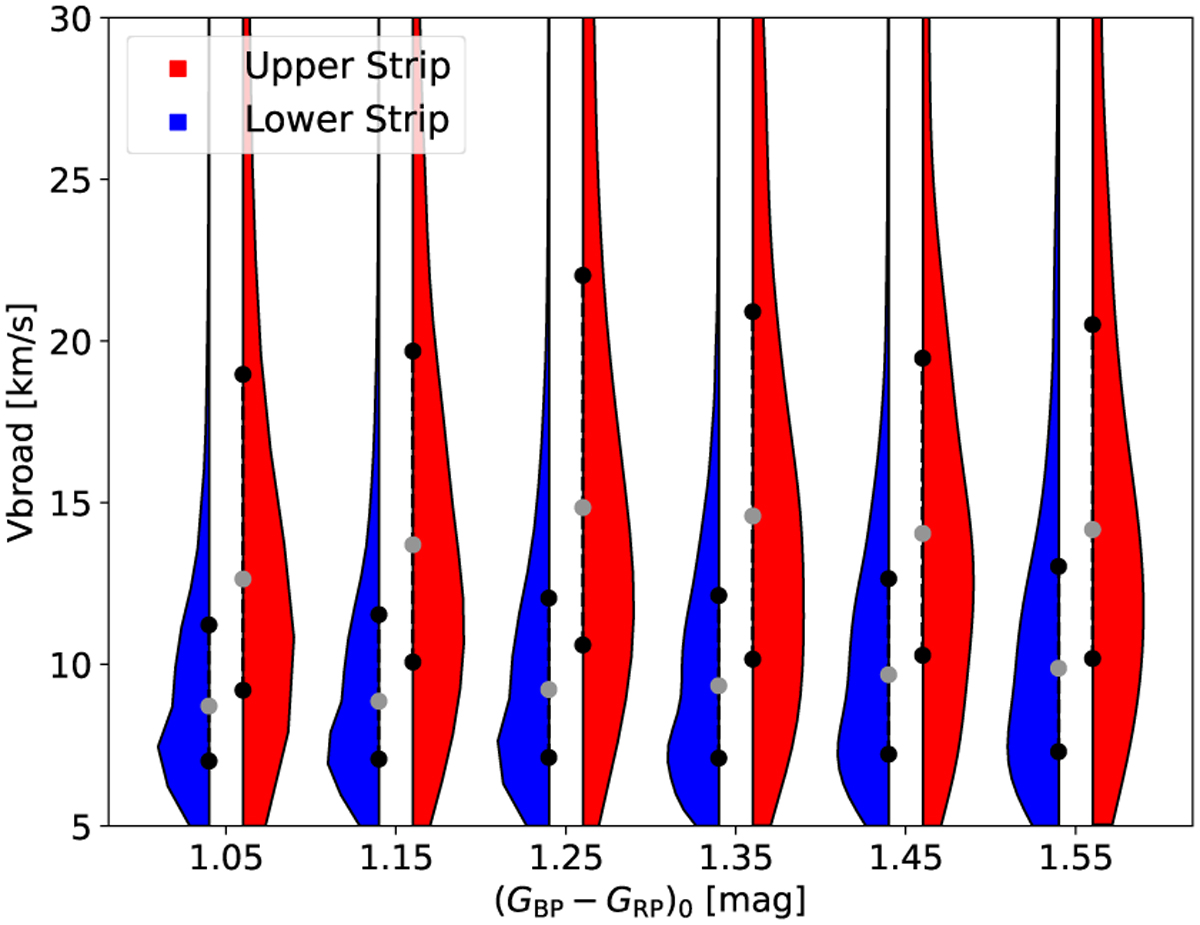
Violin plot for the Gaia vbroad values, divided by colour bin and by strip (upper vs lower), vbroad is capped here at 30 km/s for visual clarity; the upper-strip distribution is elongated and extended towards higher vbroad values than the lower one. Two black dots on each violin represent the 25th and 75th percentiles; the grey dots mark the median.
Current usage metrics show cumulative count of Article Views (full-text article views including HTML views, PDF and ePub downloads, according to the available data) and Abstracts Views on Vision4Press platform.
Data correspond to usage on the plateform after 2015. The current usage metrics is available 48-96 hours after online publication and is updated daily on week days.
Initial download of the metrics may take a while.